Paginated Reports 101 — Part 5 of 5. This post assumes you finished Part 4 with the Midwest query filter in place, and that you built the model from the sample files and setup guide. Your report total should read $822,298.65. If you kept the region parameter instead of baking in the filter, just select Midwest when you run the report and every figure below will still match.
Here’s where four posts have got us: a report that returns only the Midwest rows, with the right numbers on them. It is also pages of undifferentiated table with headers that appear once and never again, no page numbers, and a blank page wedged between every page of content.
It works, but nobody would want to receive it.
This post is the difference between those two things, and it’s the part most people skip because it feels like fiddling. It isn’t. A report that prints badly doesn’t get read, and a report that doesn’t get read may as well not exist.
Do this last, on purpose
The instinct is to set your page size first, the way you’d set up a Word document before typing. Do the opposite: leave page setup until the report body is finished and let the content tell you what it needs.
You don’t know how wide the report is until the columns are in and sized. You don’t know how tall a row is until the fonts are set. Pick 8.5 by 11 portrait on day one and you’ll spend the next hour squeezing six columns into a space that was never going to hold them, and you’ll blame the columns.
So: build it, then size it. Which is what we’re doing now.
The three things you’re actually trying to fix
Naming them helps, because they’re separate problems with separate solutions and it’s easy to chase one while making another worse.
- Clean pagination. Content breaks where it should, and there are no blank pages in between.
- Headers that repeat. On paper, every page needs its column headers. On screen, they should stay put while the reader scrolls, like a frozen pane in Excel.
- A findable title and page numbers. If a page falls out of a stack on a conference table, somebody should be able to tell what it is and where it goes.
Set the page size
Click the gray area outside the report body, then look at the Properties pane on the right. If it isn’t there, turn it on from the View tab.
You can also right-click and choose Report Properties for a friendlier dialog. Both edit the same underlying properties and they stay in sync, so use whichever you prefer. One catch: the dialog doesn’t expose everything, and the property we need in a moment only lives in the Properties pane.
For our six-column report, letter landscape is the right call:
- Page width: 11in
- Page height: 8.5in
- Margins: 0.5in all round
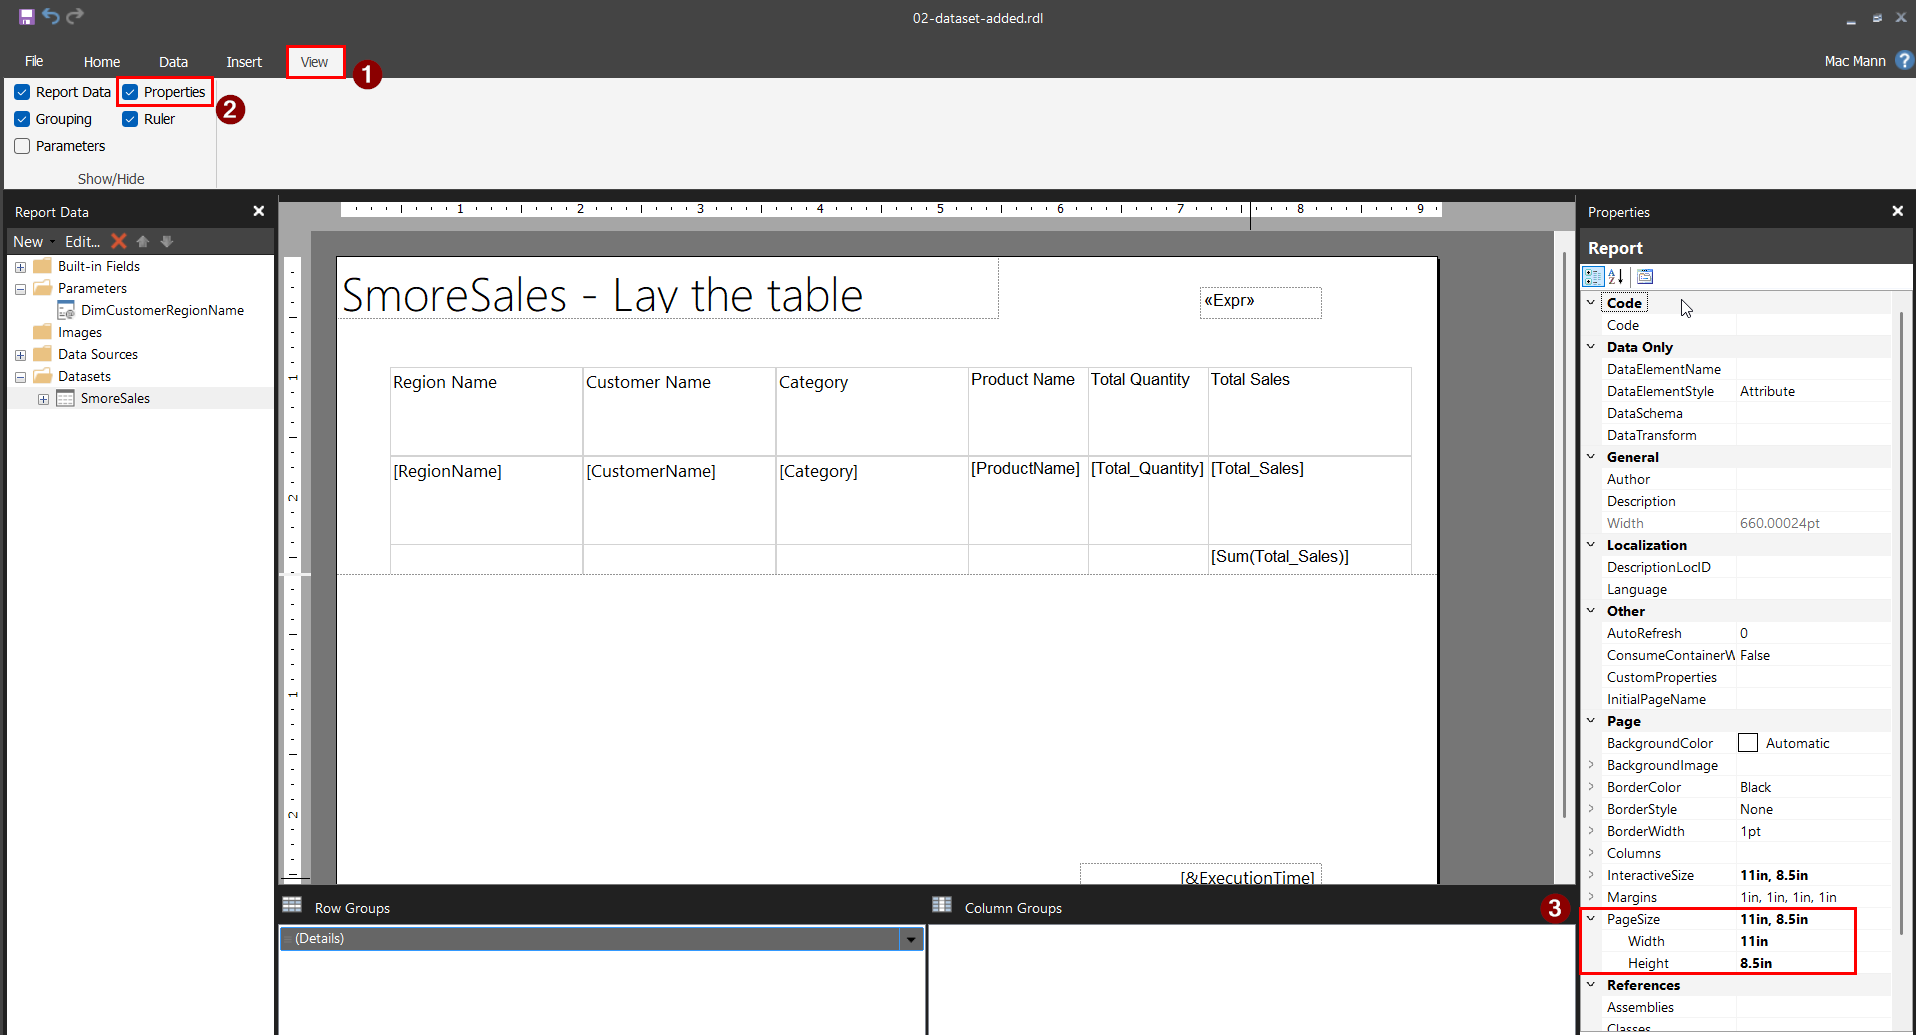
Portrait would work too, at a squeeze. Six columns need roughly seven inches and portrait letter gives you 7.5, so it fits but nothing is comfortable. Landscape gives you ten inches and room to let the product names breathe.
Then size the body to match
Your report body has its own width, separate from the page width. If the body is wider than the page minus the margins, Report Builder does what you’d expect and puts the overflow on its own page. That’s where mystery blank pages come from: they aren’t blank, they’re the two millimeters of body you didn’t notice hanging off the right edge.
So click the body itself, find Width in the Properties pane, and set it to 10in. Width and Height for the body only appear in the Properties pane, not in the right-click dialog, which is the first of two reasons you’ll end up living in that pane.
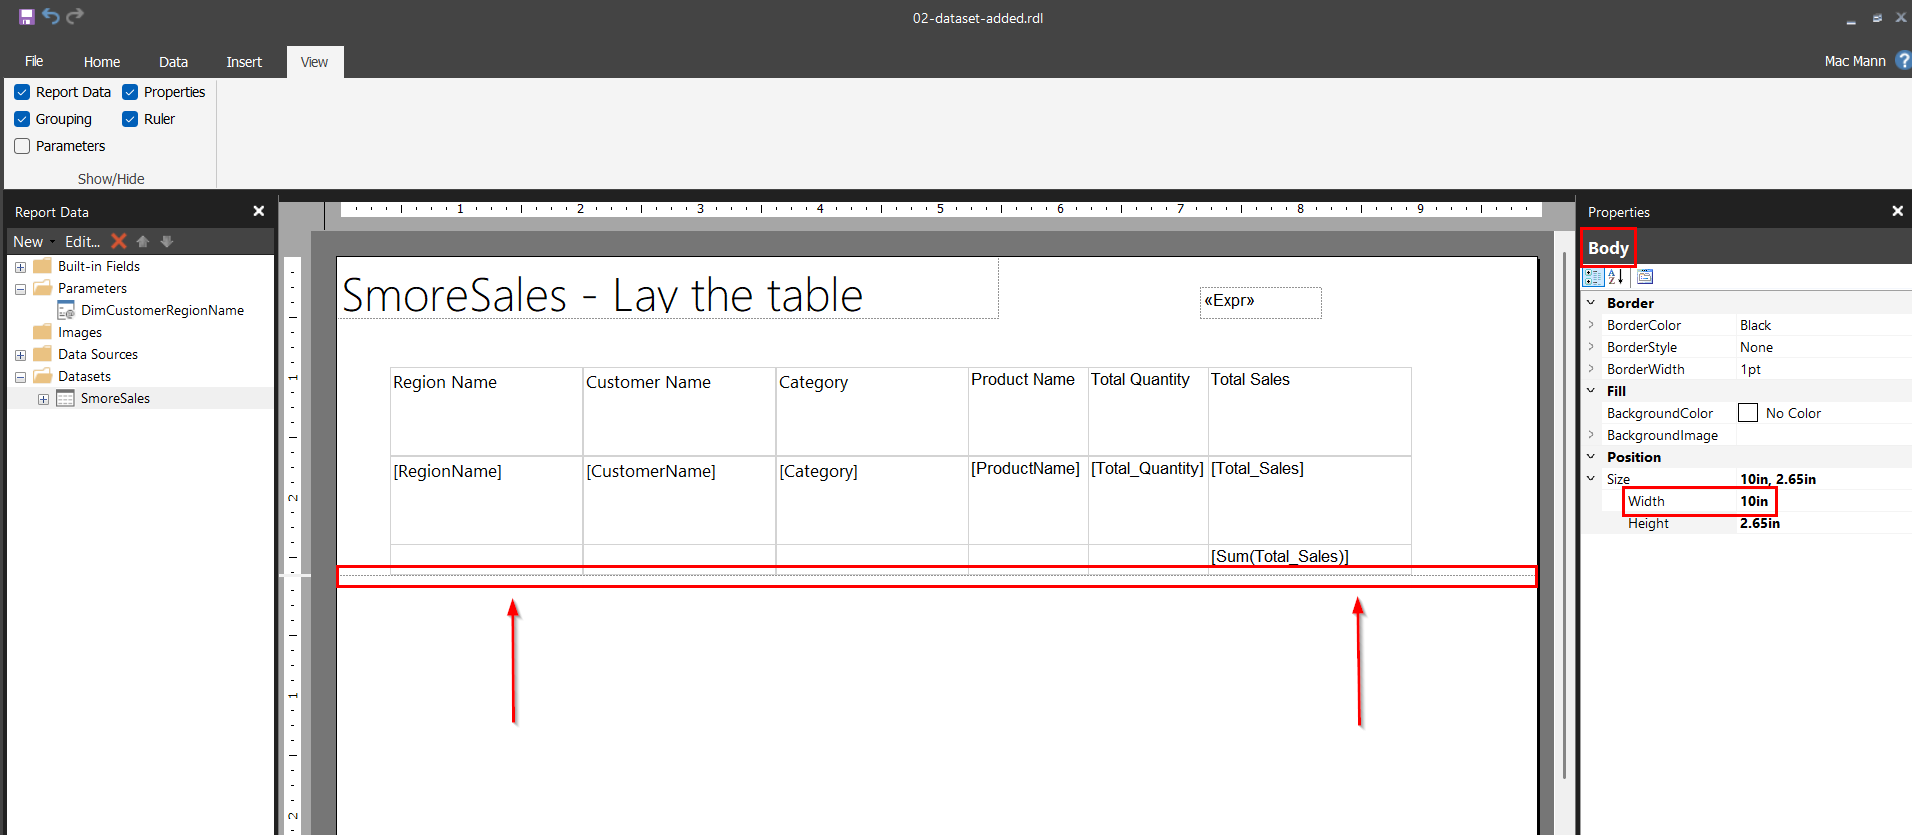
While you’re there, drag the bottom edge of the design surface up until it meets the bottom of your table. Trailing empty space at the bottom of the body paginates just like trailing space on the right.
The property with the worst name in Report Builder
Here’s the second reason you need the Properties pane.
Select the report — the gray space — scroll down the alphabetical property list, and find ConsumeContainerWhitespace. Set it to True. It may already be set, but not always.
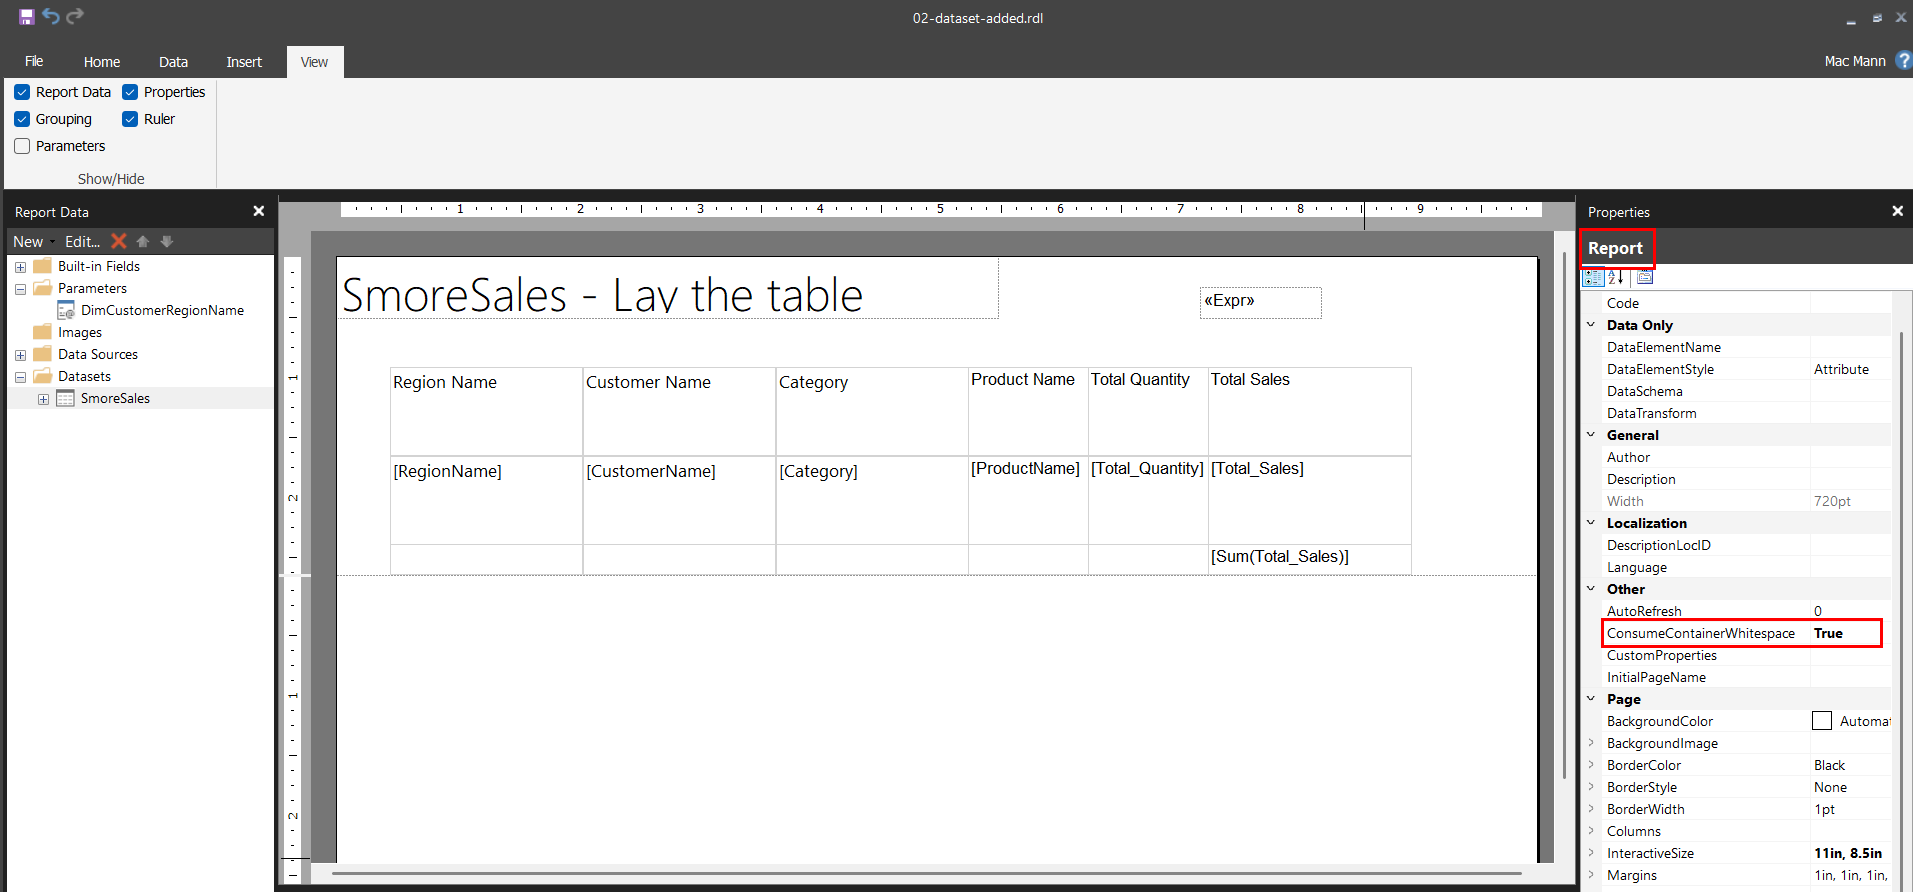
In plain English: when this is True, Report Builder throws away the minimum whitespace inside containers — to the right of and below them — instead of faithfully reproducing it. Left at False, it preserves every gap you accidentally left behind, those gaps get rendered, and rendered whitespace becomes pages.
It is the single highest-value property in this post.
When you still get blank pages
If pages are still appearing where they shouldn’t, work through these in order. It’s nearly always one of the first two.
- Body too wide. Recheck the arithmetic above. Then check it again after any column resize, because widening a column widens the body silently.
- Trailing whitespace. Drag the design surface edges in to hug the outermost item on both the right and the bottom.
- A page break you forgot about. Check the BreakLocation property on your Tablix and on any row groups. A break set to Between on a group with 34 members gives you 34 page breaks.
- KeepTogether fighting you. An item told to stay in one piece that can’t fit in the remaining space gets pushed to the next page, leaving a gap behind it.
- Header or footer height. These eat into the body’s usable height. A tall header plus a full-height body overflows.
Preview after each change rather than after all five. Otherwise you fix it and have no idea which change did it, which helps nobody next month.
Make the headers repeat
On page one your column headers are perfect. On the remaining pages there are none, and the reader is looking at a wall of numbers with no idea which column is which.
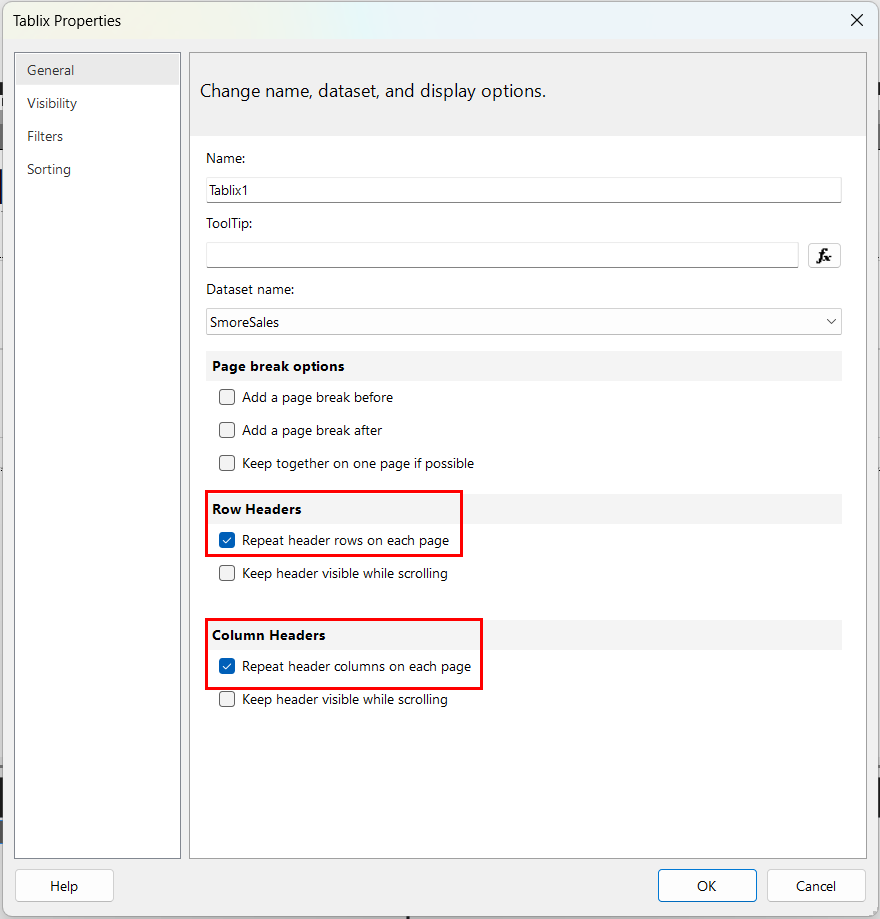
The advertised fix is a checkbox. Right-click the Tablix and choose Tablix Properties.
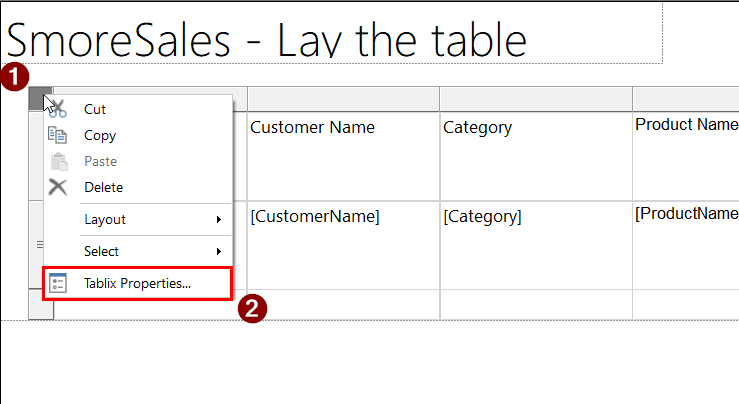
On the General tab, tick Repeat header rows on each page and Repeat header columns on each page.
Preview. If the headers now repeat, skip the next section.
When that checkbox does nothing
Quite often it does nothing, and this is the part the original version of this post hand-waved past. The checkbox only works when the Tablix has row groups for it to attach the header to. On a flat detail table like ours, the header row is a static member and the checkbox has nothing to hold onto.
The real fix lives in the Grouping pane at the bottom of the designer.
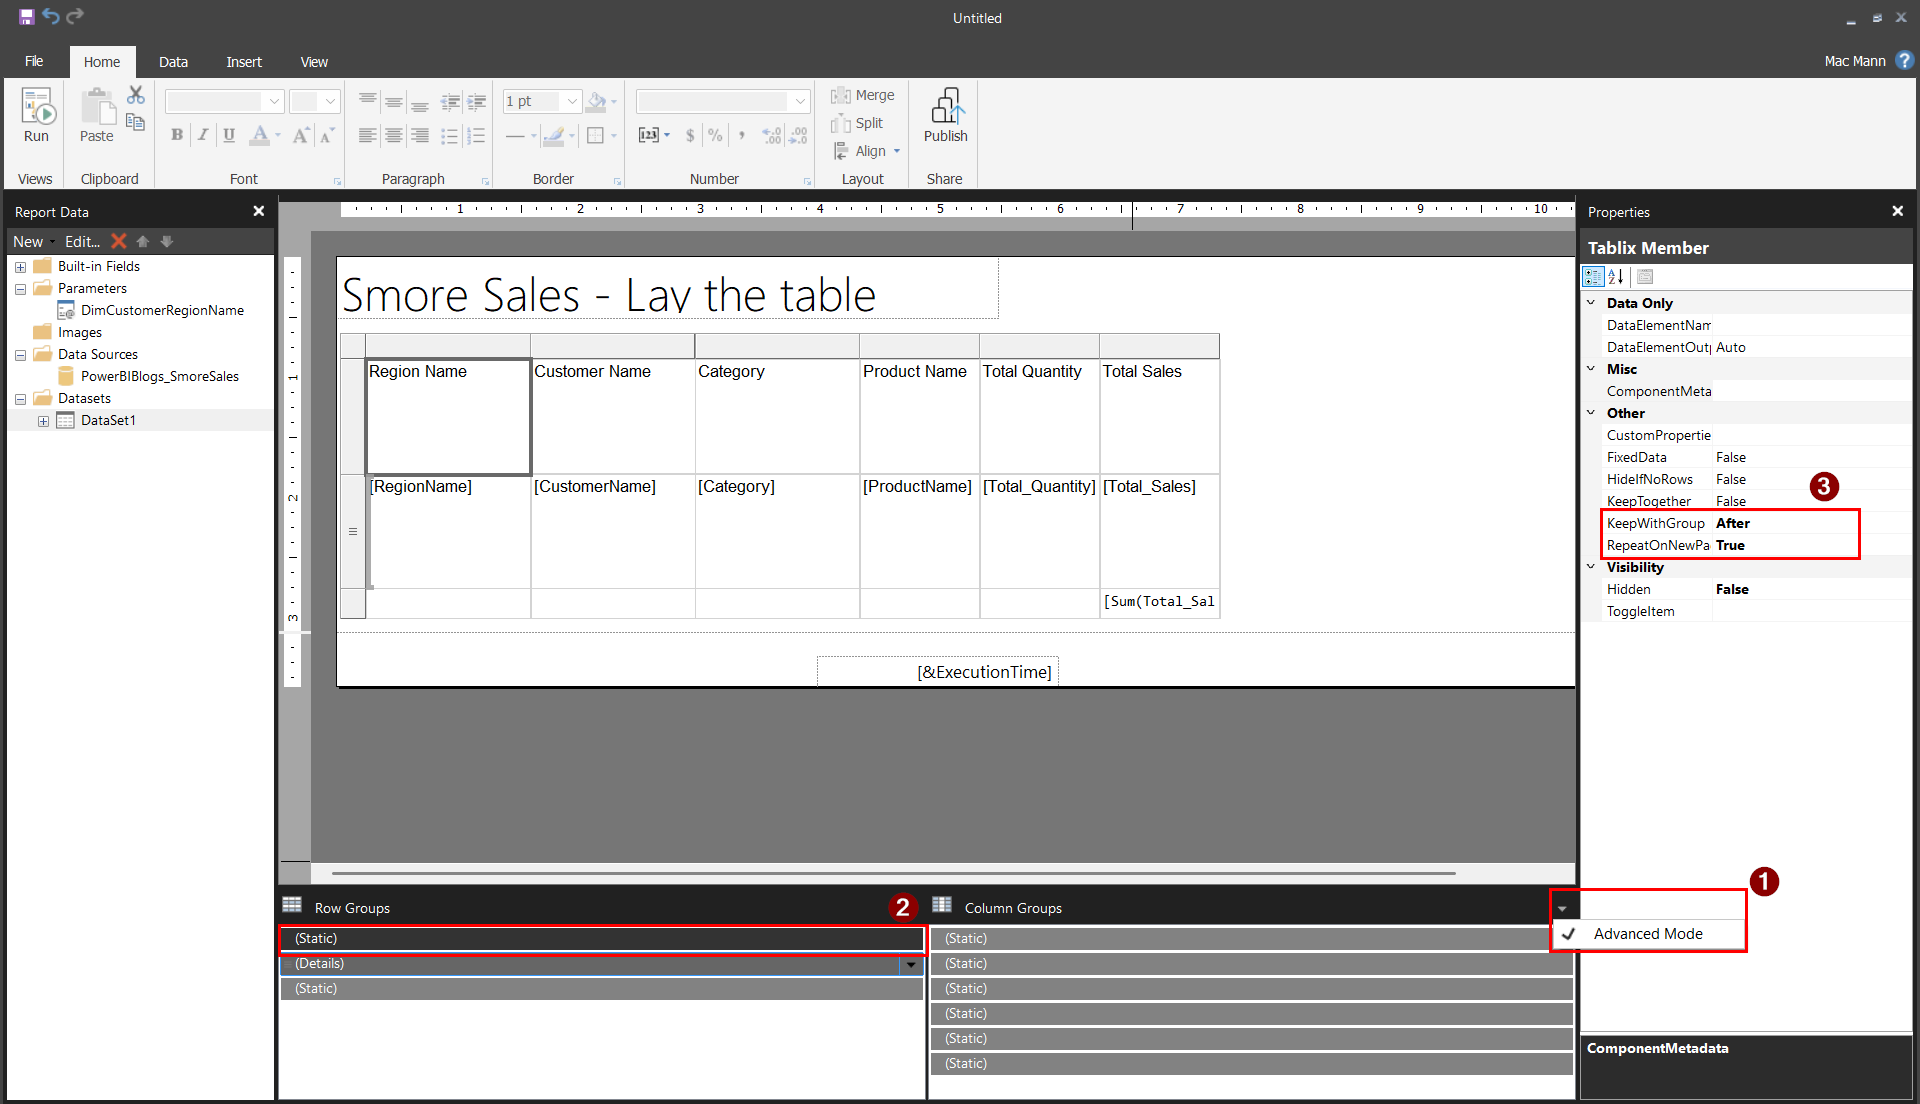
Click the small dropdown arrow on the right edge of the Grouping pane and turn on Advanced Mode.
The Row Groups list now shows (Static) entries you couldn’t see before. Click the one sitting above your detail group. That’s your header row.
In the Properties pane, set RepeatOnNewPage to True, and set KeepWithGroup to After. This second one is the step people miss — without it, RepeatOnNewPage has no group to follow and silently does nothing.
Headers that stay put while scrolling
Repeating headers solve paper. They do nothing for the person scrolling the report in a browser, which is how most people will actually read it.
Back in Tablix Properties, tick the options to keep the header visible while scrolling, for rows and columns as appropriate. Then do the step everybody forgets.
A title on every page
Your title currently sits in the report body, which means it appears once, at the top, on page one. Fine for a document somebody reads front to back. Not fine for pages that might get separated.
Go to Insert and choose Header, then Add Header. You get a band across the top of every page.
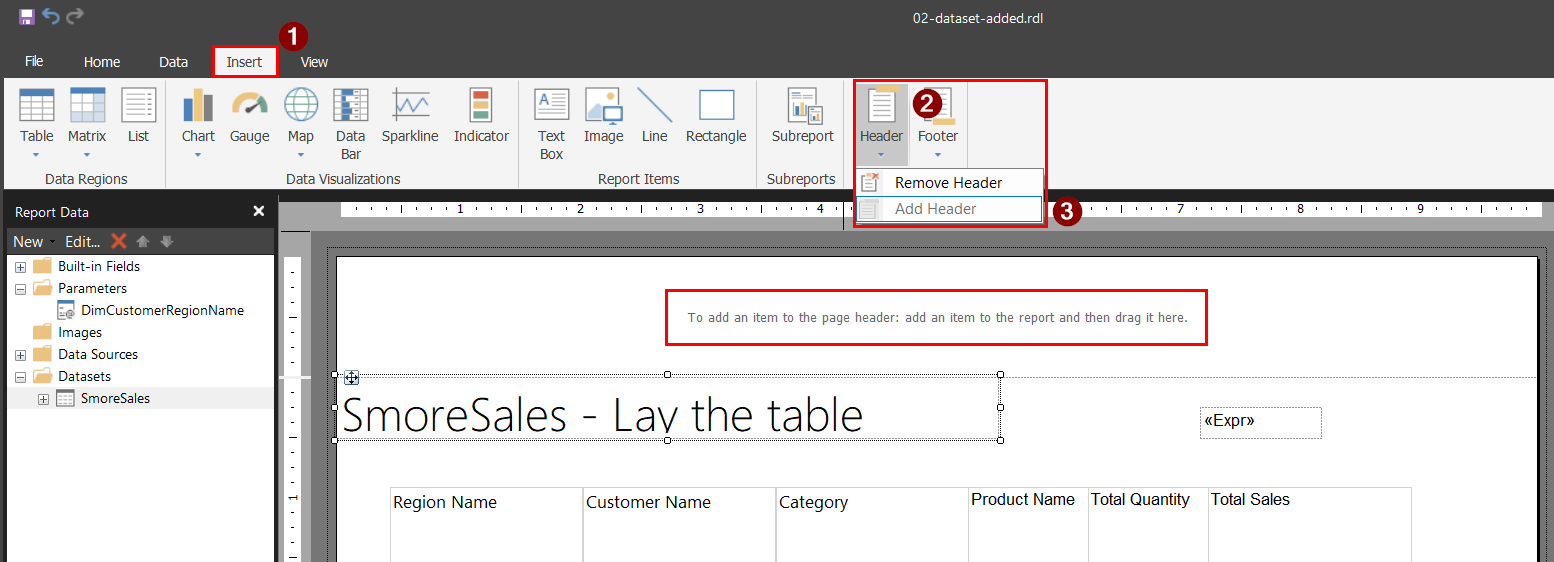
Two ways to use it. Move the title into the header and let it appear on all pages identically. Or, better for anything going in front of an executive, leave the big title in the body for page one and put a smaller running head in the page header for the rest.
To do that, add your running-head text to the page header band — ours reads Quarterly Sales Report — then select the page header, open its properties, and set PrintOnFirstPage to False.
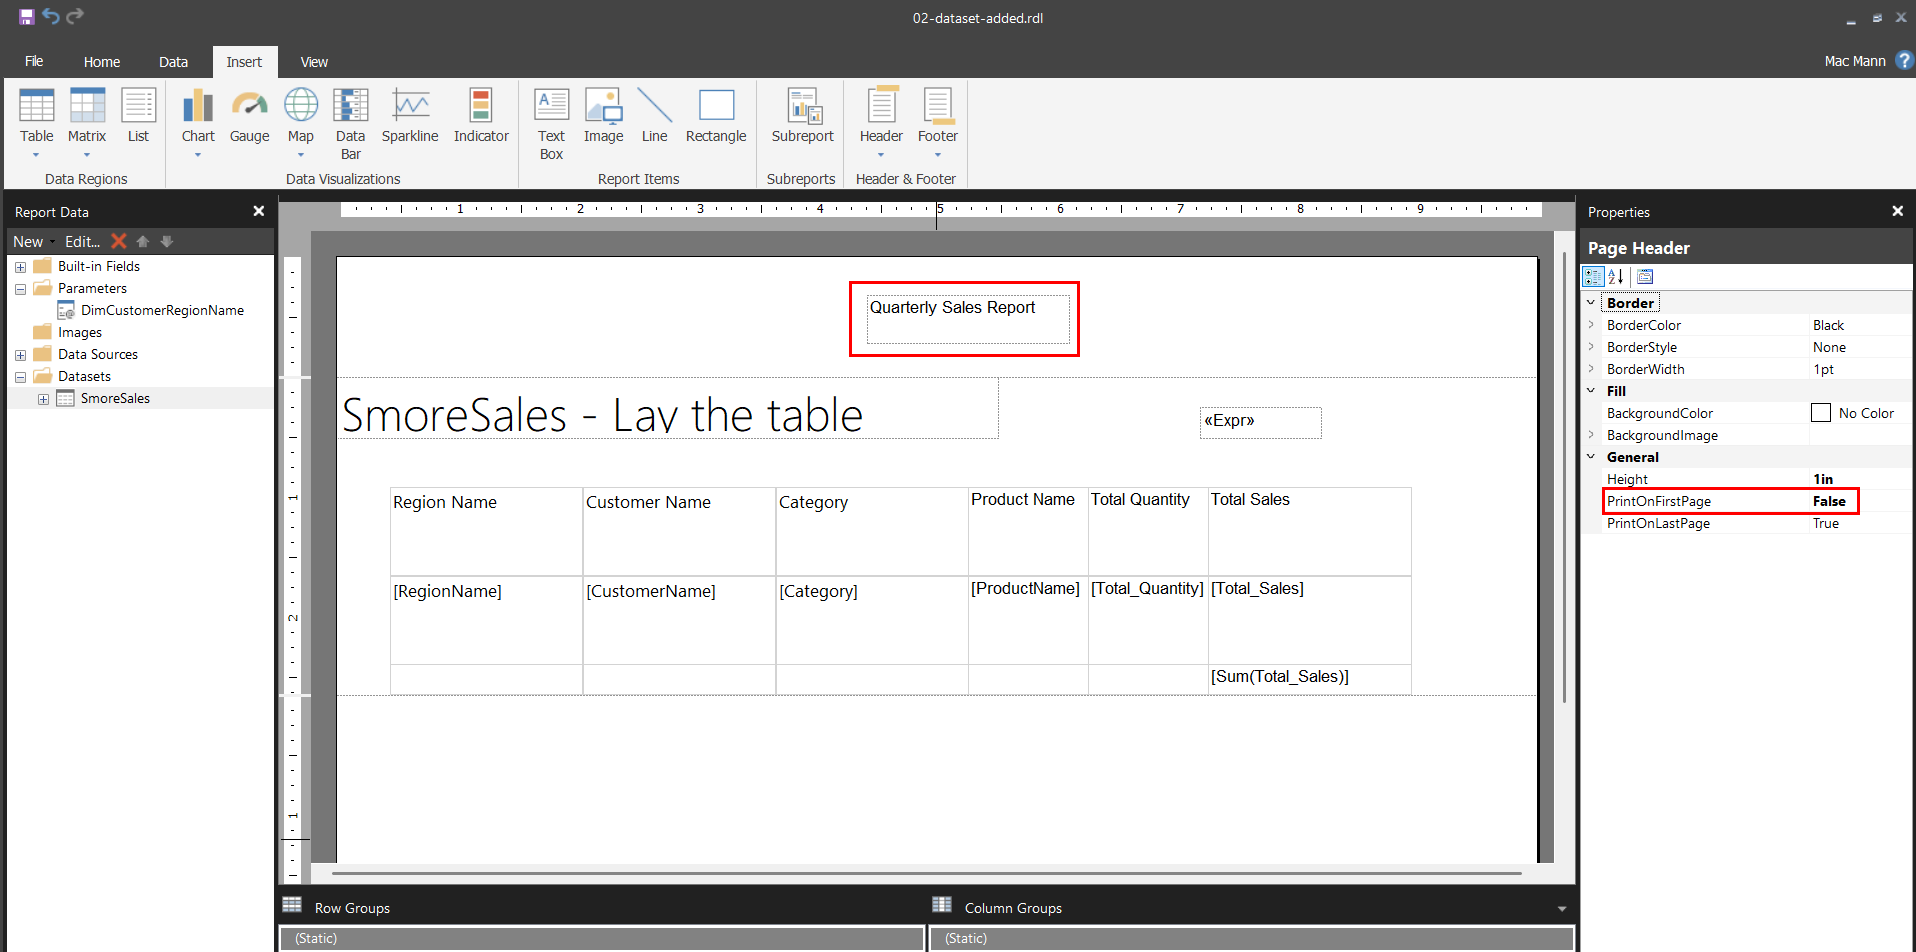
That costs you one property, and it’s what a well-made board pack does. If your report has a region parameter, put the selected value in the running head too: a page reading “Quarterly Sales Report — Midwest” tells the reader far more than one reading “Quarterly Sales Report.”
Page numbers
Add a footer the same way, then in the Report Data pane expand Built-in Fields. Drag Page Number into the footer and you get:
[&PageNumber]Which gives you a bare number. “7” tells a reader they’re on page seven of something, but not whether twelve more are coming. Replace the expression with:
=Globals!PageNumber & " of " & Globals!TotalPages & " pages"Now it reads “X of XX pages”, and anyone holding a loose sheet knows what they’ve got and what’s missing. Combined with the running head, a single page that falls out of the stack identifies itself completely.
Export it before you call it done
Preview in Report Builder is not the same renderer as PDF, and PDF is not the same as Excel. A report that looks right on screen can paginate differently on export, so check the formats your readers will actually use.
- Run the report, then export to PDF. Page through the whole thing looking for blanks and orphaned headers.
- Export to Excel if anyone will want the numbers. Check the columns land in separate cells rather than merged into a mess.
- Confirm the total still reads $822,298.65 for Midwest. Formatting work shouldn’t change your numbers, but it’s a five-second check and it has caught us before.
Publishing it
Upload the .rdl to your workspace and it behaves like any other item: it can go in an app, be shared, and be scheduled for email delivery.
Two things to know. There’s a 20 MB limit on .rdl uploads, and if you hit it the cause is almost always embedded images — reference them by URL instead and the file shrinks dramatically.
The other is newer and genuinely useful: paginated reports now work with Git integration in Fabric workspaces. You can commit an .rdl to source control and sync it, which means operational reports finally get version history and a review process like any other code. If you’ve ever had somebody overwrite a working report at month end, you’ll appreciate why that matters. (Git integration carries its own capacity requirements, which are outside the scope of this post.)
That’s the series
Five posts ago this was a Power BI report that wouldn’t print. Now it’s a paginated report that pulls from your existing semantic model, returns only the rows that matter, and prints identically every time — with a region picker if you decided your readers should have one.
The part worth taking away isn’t any individual property. It’s that operational reporting is a different discipline from analytics, with its own tools and its own failure modes, and that treating it as an afterthought is why so many organizations have a folder full of reports nobody trusts.
If you want to keep going, dynamic titles that respond to parameters are a good next step. So are date parameters — though read up before you build one, because they misbehave in ways that are hard to diagnose from scratch.
Related How to Fix Date Pickers in Paginated ReportsThe full series
- When to use a paginated report
- Using a semantic model as your data source
- Building your paginated report dataset
- Adding parameters and filters
- Getting print and view ready (you are here)