Your analytical report works. Everyone has finally agreed on the source data, you’ve got a working semantic model, it refreshes on a schedule, and the people who use it have stopped emailing to ask whether it’s right. Then someone points out they need it printed, and the dashboards you spent hours perfecting turn into a jumbled, broken, split-page mess.
You might be thinking: Report Builder has Power Query now, so I’ll just connect straight to my source data and build something new. There’s a better way, and it doesn’t require wrangling reference fields, keys, measures and relationships for the umpteenth time.
The slight catch is that doing this means untangling three different things that have all been called a “dataset.”
Paginated Reports 101 — Part 2 of 5. Start with Part 1: when to use a paginated report, and grab the sample files and setup guide so your screen matches ours from here on.
Why this title sounds like nonsense
If you read the title and thought “wait, isn’t the report basically the dataset?” — fair. The naming here has been confusing for years, and the 2023 rename made it better in some places and worse in others.
Three things you need to be able to tell apart:
- The Power BI semantic model. This is the thing that used to be called a dataset, and that many people still casually call one. It holds your tables, relationships, measures and — depending on how you connected — the data itself.
- The Power BI report. The visuals and pages your users interact with. This reads data from a semantic model.
- The paginated report’s dataset. A single query inside your .rdl file that returns one flat table. This one kept the name “dataset” and was deliberately left out of the rename.
That last one is why this series needs two posts to cover what looks like one task. This post is about the connection. Part 3 covers the query.
What actually happens when you publish a .pbix
Open Power BI Desktop and build a report, even a simple one. Publish it, then go look at your workspace. You will find two items: a report and a semantic model.
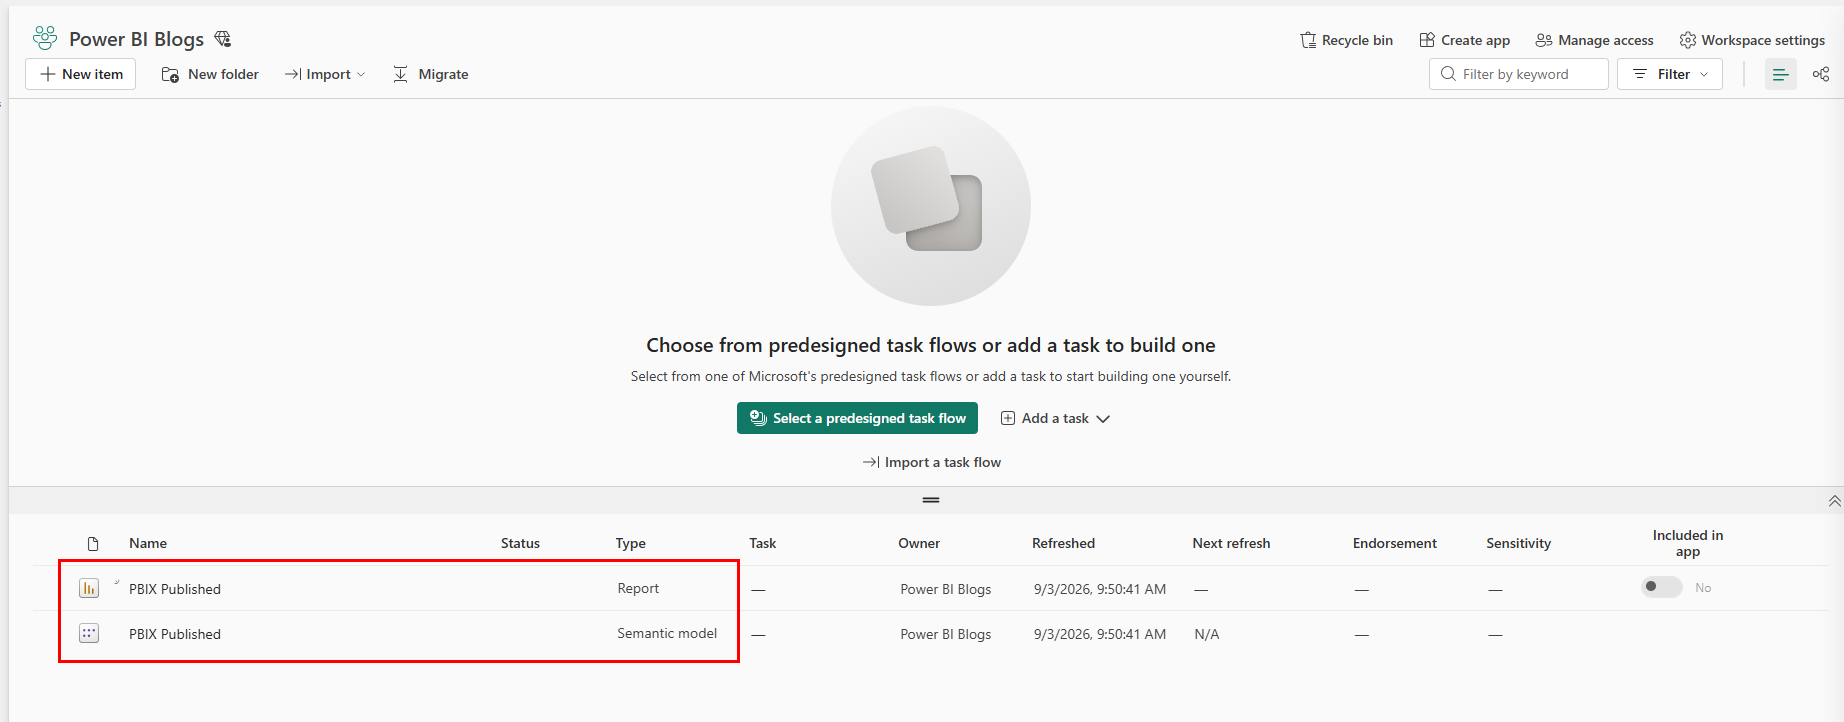
They came from the same file, but they now live separate lives. The report holds the layout. The semantic model holds the tables, the relationships, the measures and the refresh schedule. Only the semantic model refreshes, because the report has nothing in it to refresh.
If you have used a .pbit template file, this split should feel familiar. A template carries the structure and the queries but none of the data, so opening one sends it off to fetch everything fresh. Publishing a .pbix does something comparable in the other direction: it separates the recipe from the pantry and puts them on different shelves.
An .rdl is only ever the recipe
A paginated report never gets a pantry. The .rdl file holds instructions and nothing else: connect here, run this query, lay the results out like this, break the pages there. Every time somebody runs the report, it goes and fetches the data again.
This is why paginated reports feel different to work with. There is no import step and no refresh schedule to manage, because there is no stored data to refresh.
What paginated reports can connect to
Report Builder has its own equivalent of Get Data, and this is the part of the original post that has aged most.
In 2023, the honest answer was that paginated reports reached a fairly short list of sources. That is no longer true. Microsoft added Power Query to Report Builder and took it to general availability in September 2024, bringing hundreds of connectors along with the ability to filter, sort, merge and clean data inside the report itself. If your only reason for wanting a semantic model was to reach a connector Report Builder didn’t have, that reason has largely gone away.
So why use a semantic model at all?
Because connectivity was never the good reason. It was just the most obvious one. In 2023, when you were faced with connecting data to a paginated report, using a semantic model as an integration layer made the most sense on those grounds alone. The better argument is governance.
- One definition of the truth. Everyone has fought the “why is the printed report different from the electronic one?” conversation. Two data models means two potential break points: the model itself and the report parameters.
- Measures you don’t have to rewrite. Net revenue took weeks of meetings and days of formula-writing to define. Rebuilding it in Report Builder means building it twice, maintaining it twice, and giving it two places to break.
- One refresh to think about. The model already refreshes on a schedule somebody agreed to. Your paginated report reads whatever is current at the moment it runs.
- Someone already validated it. The model has been in use, which means its mistakes have mostly been found. No second validation pass, and no frustrating your users with one.
There are cases where connecting directly still makes more sense. If you need row-level detail the model doesn’t have — likely by design, though sometimes by omission — or the report has to run against a system the model isn’t connected to, connect directly.
Think hard before running separate models for the paginated versions of your on-screen reports. If you can’t name a specific, articulable reason you need two, that’s a signal to challenge the framework rather than duplicate it.
Connecting to the model
Open Report Builder and start a blank report. Everything here happens in the Report Data pane on the left.
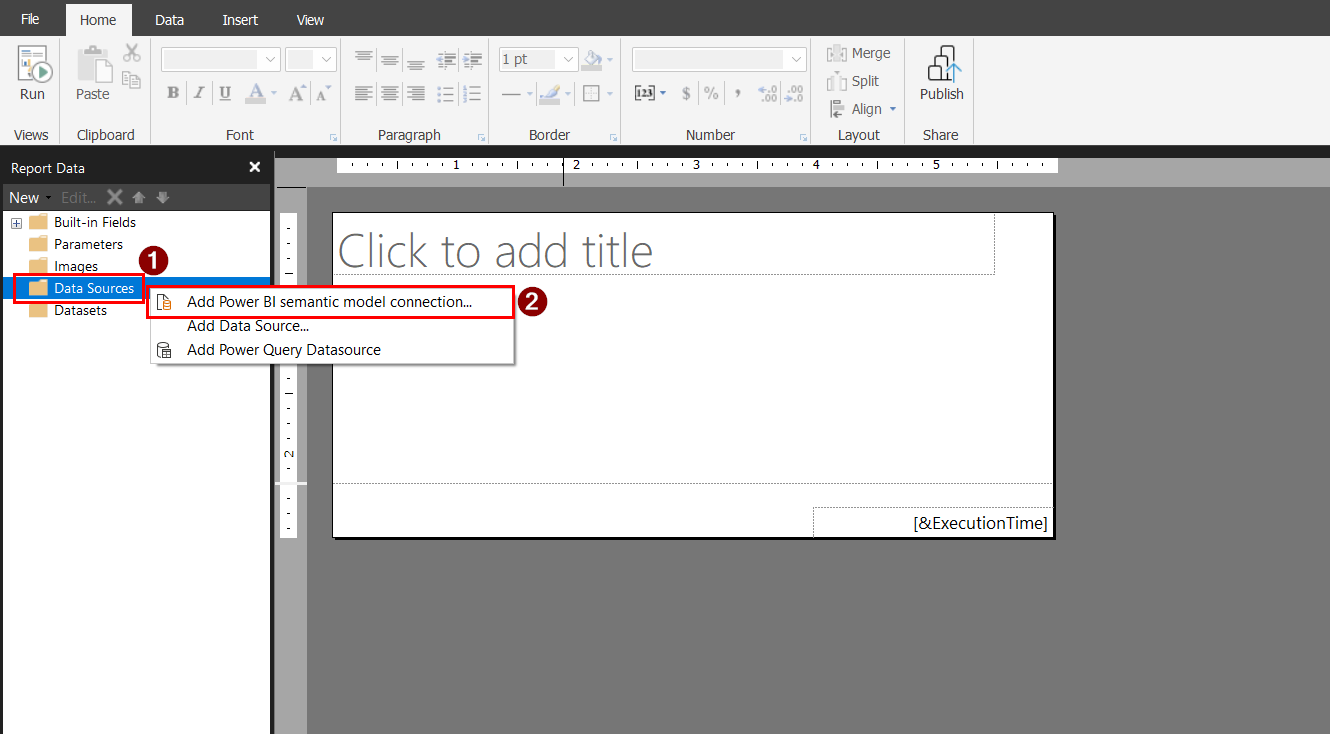
Right-click Data Sources in the Report Data pane, then choose Add Power BI semantic model connection.
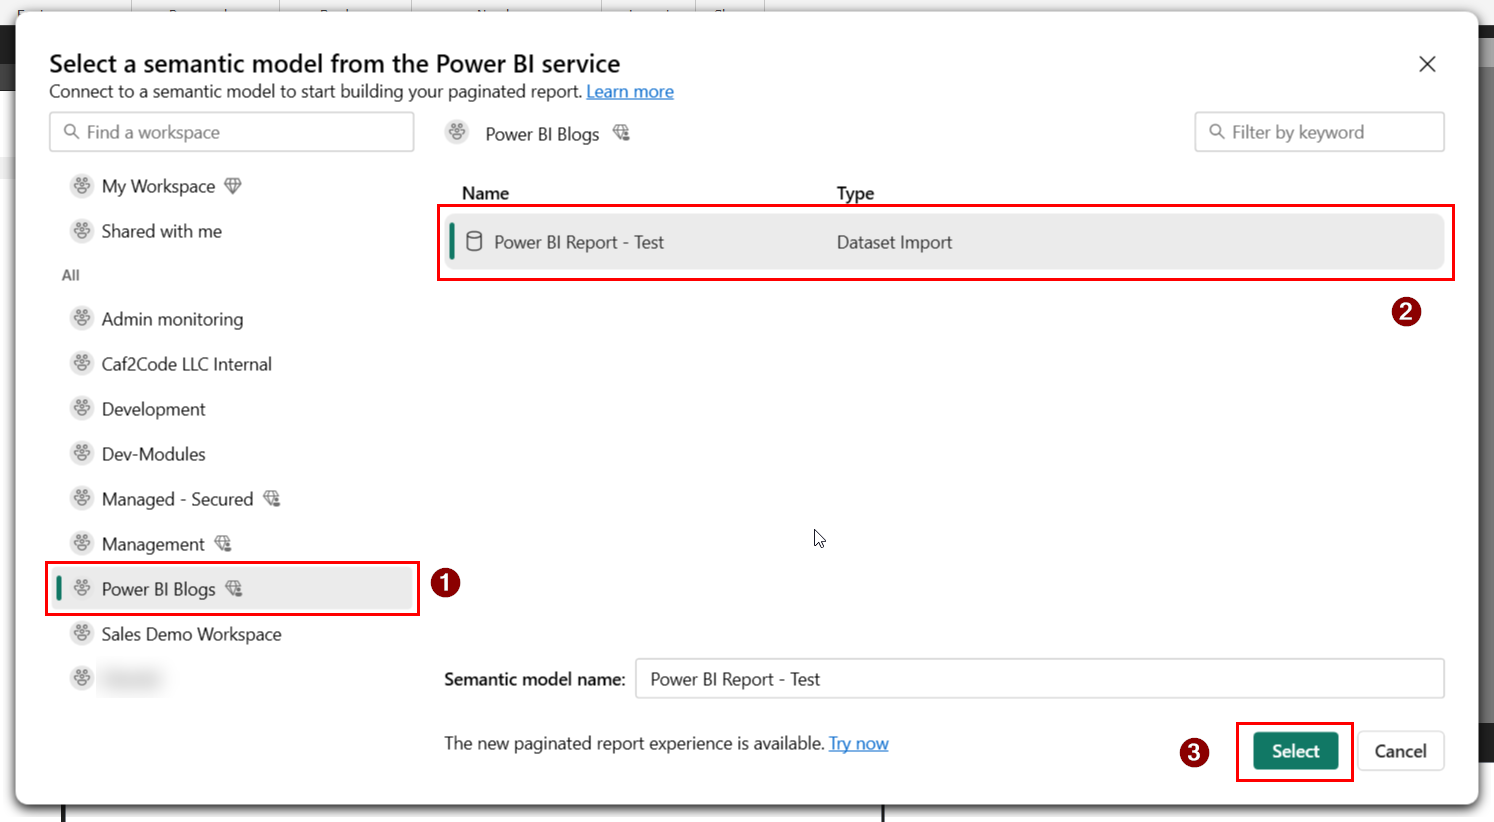
Pick your workspace, then pick the semantic model.
Click Select. The data source appears in the Report Data pane and you are connected.
There is a longer route to the same place. You can choose Add Data Source, work through the connection-type list until you find Power BI Semantic Model, and paste in a connection string. That is several more clicks than you need, and the shortcut above exists so you never have to.
One note on what you have just created: this is a live connection and it uses DAX. If you try to drop SQL or Power Query into it, you’ll discover that distinction quickly.
The permission that trips everyone up
You need two permissions to keep your connection from failing, or the model from never appearing in the picker at all:
- At least the Contributor role in the workspace you are publishing to.
- Build permission on the semantic model you are connecting to.
Build permission is the one that’s easy to miss, because you can still see the report without it. Somebody can look at a published Power BI report every day and have no right to query the model underneath it. If the model does not show up in the picker and you are certain you’re in the right workspace, this is almost always why.
On licensing: a free license lets you publish to My Workspace only. Publishing anywhere else needs more, and publishing to a workspace where free view-only users can read your report requires Fabric capacity. There is more detail in the paginated reports FAQ, Part 1 covers the basics, and Microsoft’s current licensing guide is the definitive answer.
Where this goes next
You now have a paginated report pointed at a semantic model, and no data in it. That is the expected state if you’ve followed the steps above. What’s left is telling Report Builder how to ask for the data.
Asking is where it gets interesting, because the Query Designer in Report Builder does not behave the way the field list in Power BI Desktop does. Drag in the same columns and you will not get the same result. That’s the next post.
Next in this series — Part 3 How to Build Your Paginated Report Dataset from a Power BI Semantic Model