Paginated Reports 101 — Part 3 of 5. This post is hands-on. It assumes you’ve built the model in the sample files and setup guide and connected to it in Part 2. Every figure below will then match your screen.
You have a paginated report connected to your semantic model. So you open the Query Designer, drag in the same fields you’d drag onto a canvas in Power BI Desktop, and run it.
You almost certainly get thousands of rows in a broken format, and everything looks terrible.
Your model is fine, your connection is fine, and the query did precisely what you asked. The issue is that Report Builder treats your request differently from Power BI Desktop. This post is about that gap.
What you’re actually building
Part 2 covered three things that have all been called a “dataset.” The one that matters here is the third: the paginated report’s dataset, a single query that returns a single flat table. It is the building block of your paginated report.
Slow down on this, because if you’re used to Power BI Desktop it is genuinely different from what you know. A semantic model is a small database with tables, relationships and measures, and it works out how to aggregate things on your behalf when you drop a field on a canvas. A paginated report dataset has none of that: one query, one result set, no relationships, no model, and no aggregation unless you explicitly asked for it.
Everything that follows is a consequence of that last sentence.
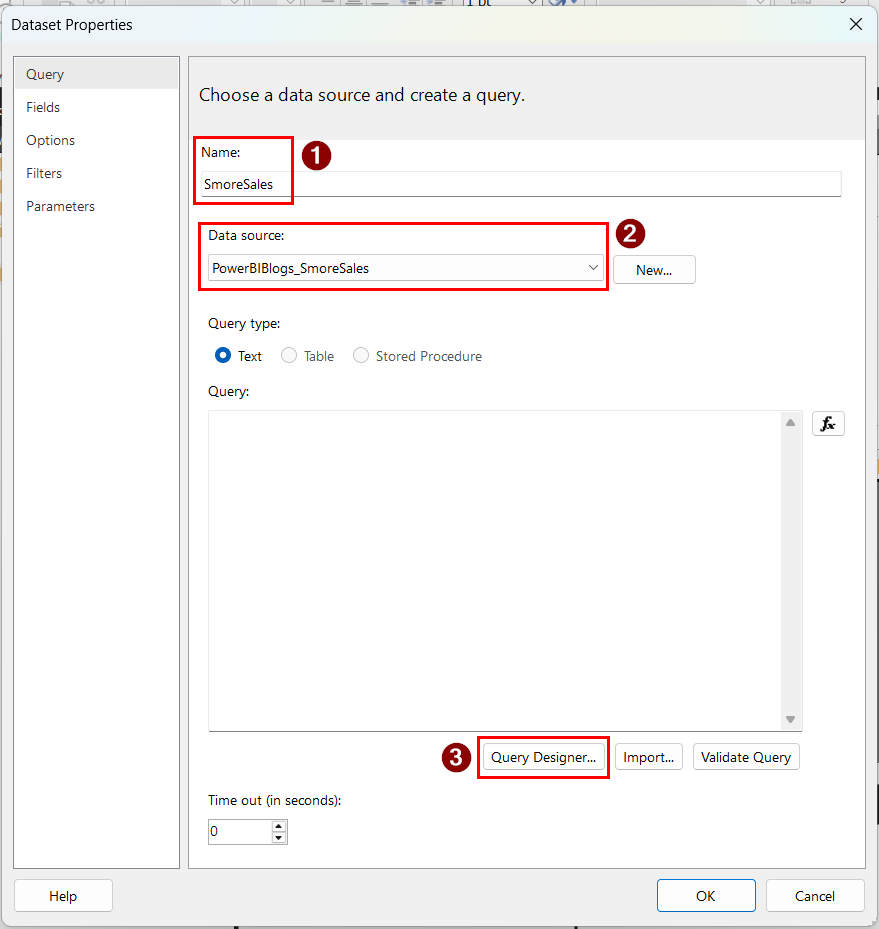
Open Report Builder, right-click Datasets and choose Add Dataset. Then click Query Designer.
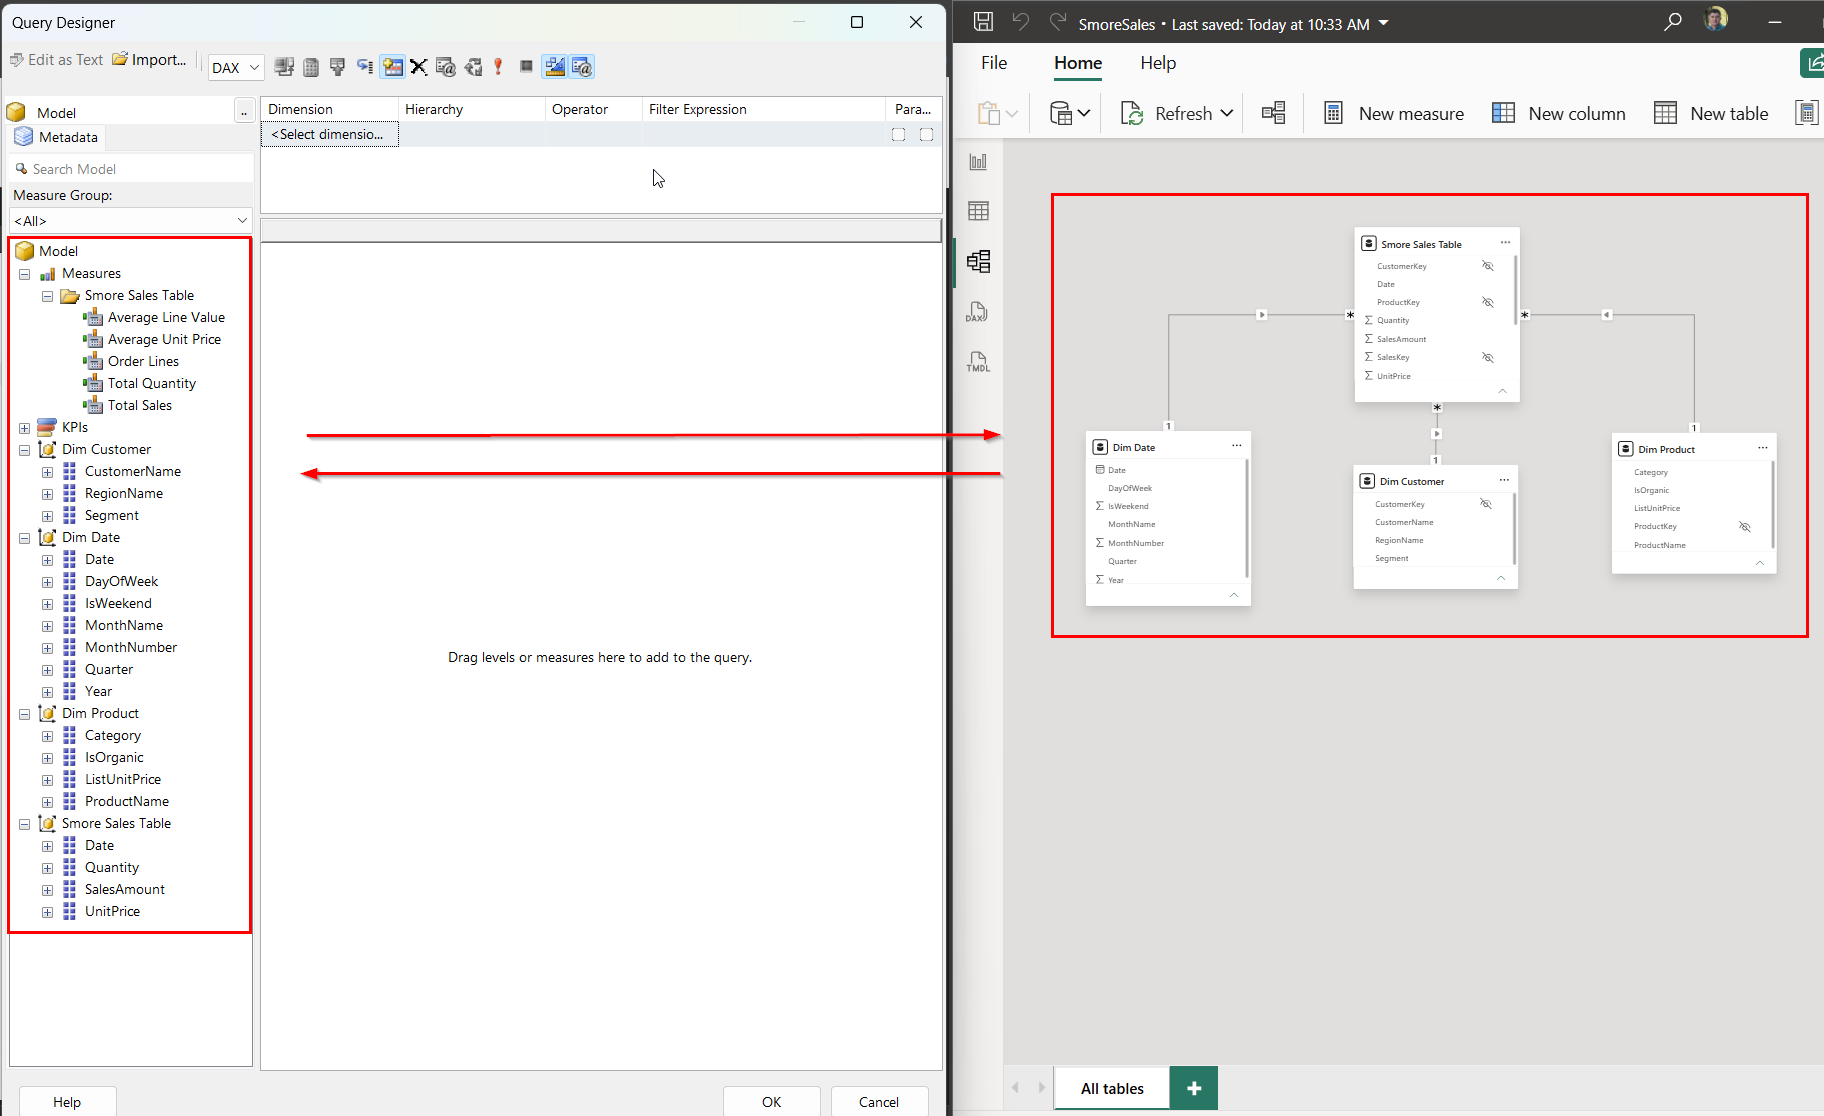
You now get a different view of the same data that exists in your semantic model. For clarity, here is a side-by-side: the semantic model in Power BI Desktop on the right, the Query Designer on the left.
Why your total came back 3,601 times
The model here is small: one fact table called Smore Sales Table with 12,000 order lines, plus product, customer and date dimensions. Two measures are defined on it, Total Quantity and Total Sales.
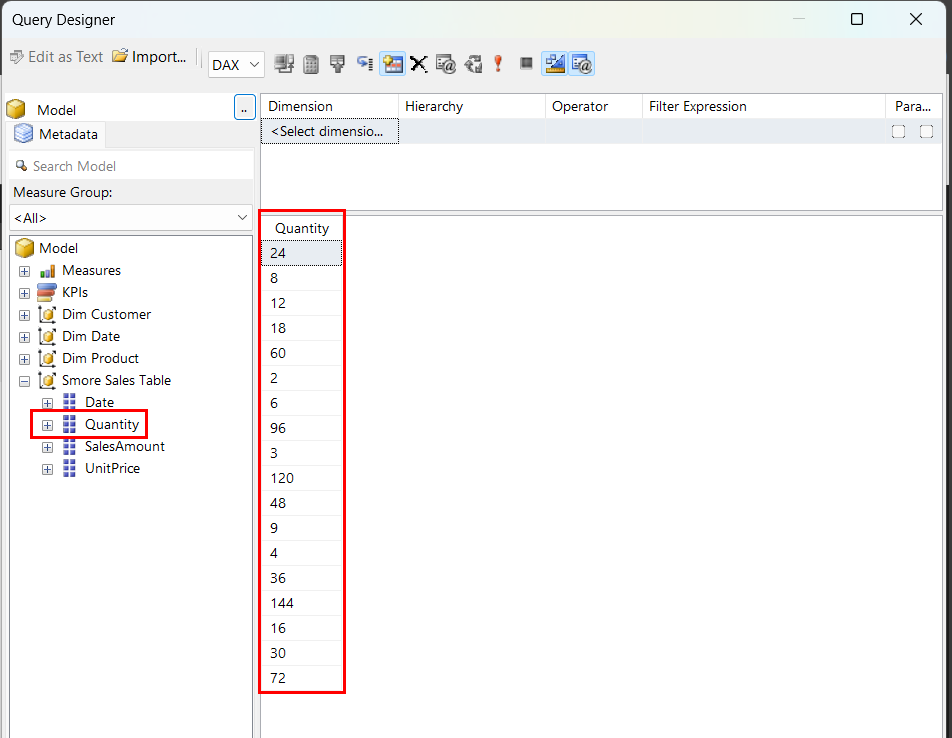
Watch what happens when you ask for a raw column instead of a measure. Drag the Quantity column into the Query Designer and it generates something like this:
EVALUATE
    SUMMARIZECOLUMNS ( 'Smore Sales Table'[Quantity] )
Run it and you get 18 rows. Eighteen, because there are exactly 18 distinct values in that column and the query returned one row for each.
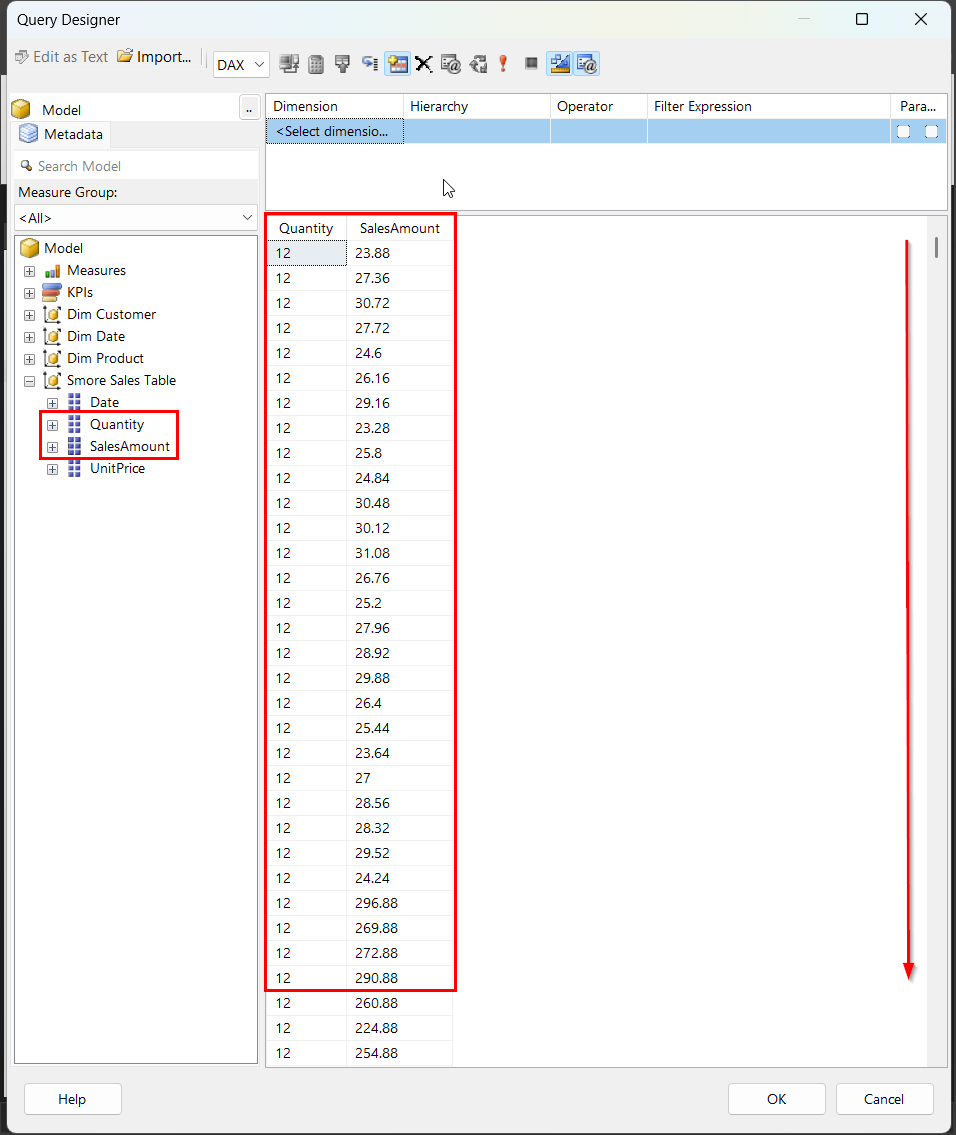
Eighteen rows is small enough to look like a mystery rather than a pattern. Try the same thing with a higher-cardinality column. SalesAmount, being currency with promotional pricing behind it, has many more distinct values:
EVALUATE
    SUMMARIZECOLUMNS ( 'Smore Sales Table'[SalesAmount] )
3,601 rows. One per distinct value again, and now it is obvious something has gone sideways. Add a second raw column and the row count multiplies rather than adds, because you’re asking for every distinct combination.
Ask for the measure instead:
EVALUATE
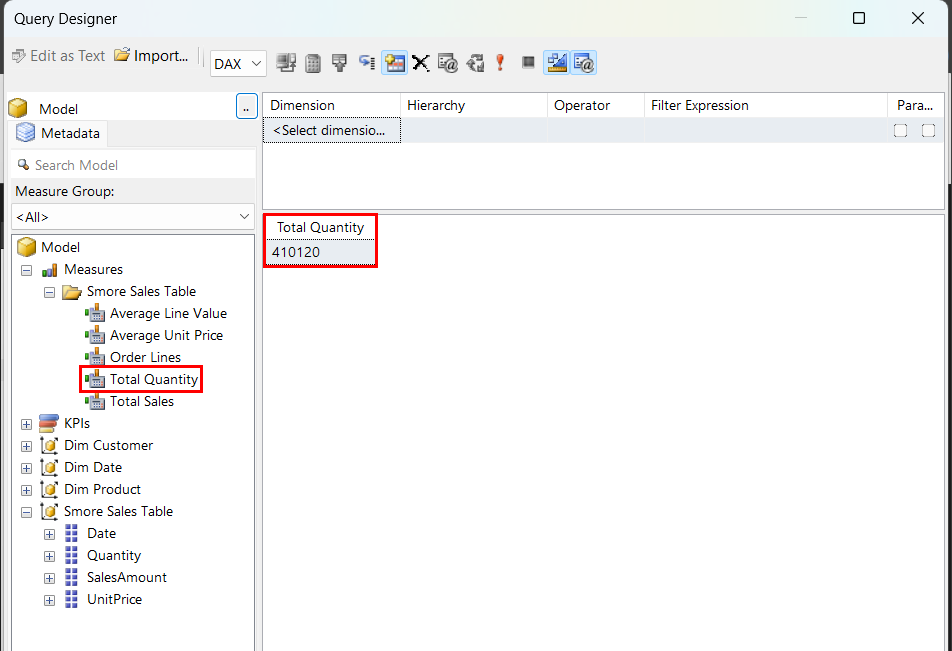
    SUMMARIZECOLUMNS ( "Total Quantity", [Total Quantity] )
One row. 410,120. This is what you wanted the first time.
What Power BI Desktop silently does for you
If you’ve spent time in Power BI Desktop, dragging a numeric column onto a visual and watching it sum itself is completely normal. That’s the source of the confusion: Desktop was doing something on your behalf that it never told you about.
When you drop a numeric column into a visual, Desktop wraps it in an aggregation for you. That’s an implicit measure. You asked for Quantity, Desktop decided you meant SUM of Quantity, and it was right, so you never gave it a second thought.
Report Builder’s Query Designer is more literal. It builds exactly the query you described and nothing more. SUMMARIZECOLUMNS groups; it does not aggregate unless you hand it something to aggregate with. A raw column becomes a list of distinct values, which is a sensible thing for a grouping function to return and a useless thing to put in a financial report.
So use measures. Always.
Your semantic model likely already has measures. If it doesn’t, build them upstream in Power BI Desktop rather than fighting with DAX inside Report Builder.
Treat this as a rule rather than a preference: for any number you intend to display, use a measure defined in the semantic model, not a raw fact-table column.
In the Query Designer, measures carry a small calculator icon in the field list. Microsoft’s own guidance says the same, and the reasons go beyond correct row counts:
- The definition lives in one place. If someone revises how net revenue is calculated, your paginated report inherits the change. If you summed a raw column yourself, it doesn’t.
- Fewer rows cross the wire. A measure returns aggregated results. A raw column returns every distinct value and asks your report to deal with it.
- It matches the on-screen report. Same measure, same number, no awkward conversation about which version is right.
If you need a number the model doesn’t have a measure for, treat that as a signal. Nine times out of ten the right fix is to add the measure to the semantic model, where every report can use it, rather than working around it inside one .rdl where nothing else can see it.
Dimension attributes are a different matter. Product name, region, customer, dates: drag those in as columns, because grouping is exactly what you want from them. The rule is about the numbers.
The shortcut: let Power BI write the query for you
Now that you know what a good query looks like, here’s the faster way to get one. You almost never have to write these by hand, and if there’s already an analytical report built on the same model, this is the first workflow to reach for.
Open the .pbix in Power BI Desktop and put a flat table on the canvas — a table, not a matrix. Drop in every field you want in the paginated report, using measures for the numbers.
Go to View and open Performance Analyzer.
Click Start recording, then Refresh visuals.
Expand the entry for your table and click Copy query.
Back in Report Builder, add a dataset, open the Query Designer, make sure DAX is selected, and switch off Design Mode. Paste the query in.
Click Execute Query (the ! button) to confirm it runs and returns what you expect.
Design Mode is worth knowing where to find. With it on you get the drag-and-drop grid. With it off you get the raw DAX text pane, which is the only place you can paste a query. If you ever open the Query Designer and find there’s nothing to drag onto, that’s the toggle.
Three things to watch for on the way through.
- Turn off totals. Microsoft’s walkthrough has you slide the Totals toggle off before recording the query.
- DirectQuery models need at least one measure. If your semantic model uses DirectQuery rather than import, Microsoft requires that the dataset include a measure.
Building one from scratch
Sometimes there’s no existing report to lift a query from. The Query Designer handles that too.
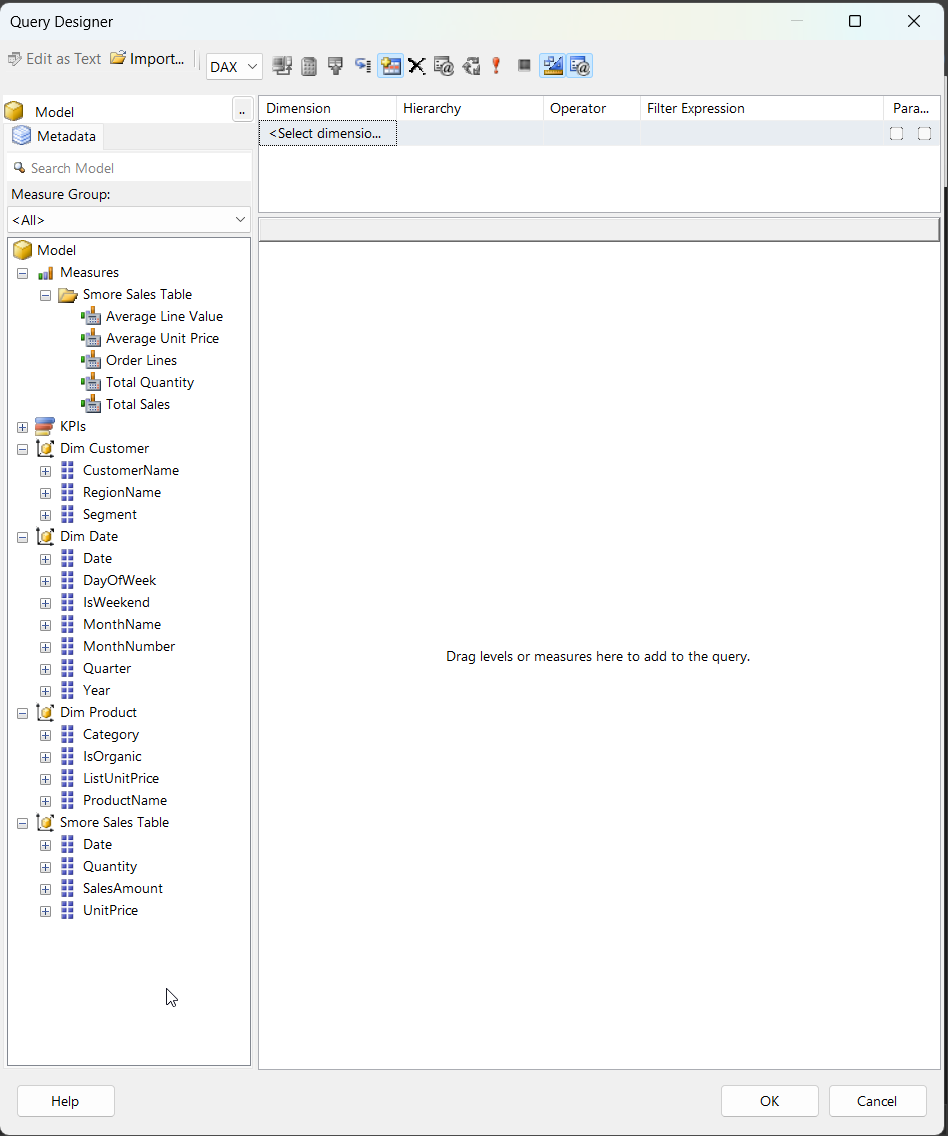
In the Report Data pane, right-click Datasets and choose Add Dataset.
Name it something you’ll recognize in three months, pick your data source, and click Query Designer.
Drag your dimension attributes and your measures across from the field list on the left.
Click OK. Report Builder writes the DAX for you.
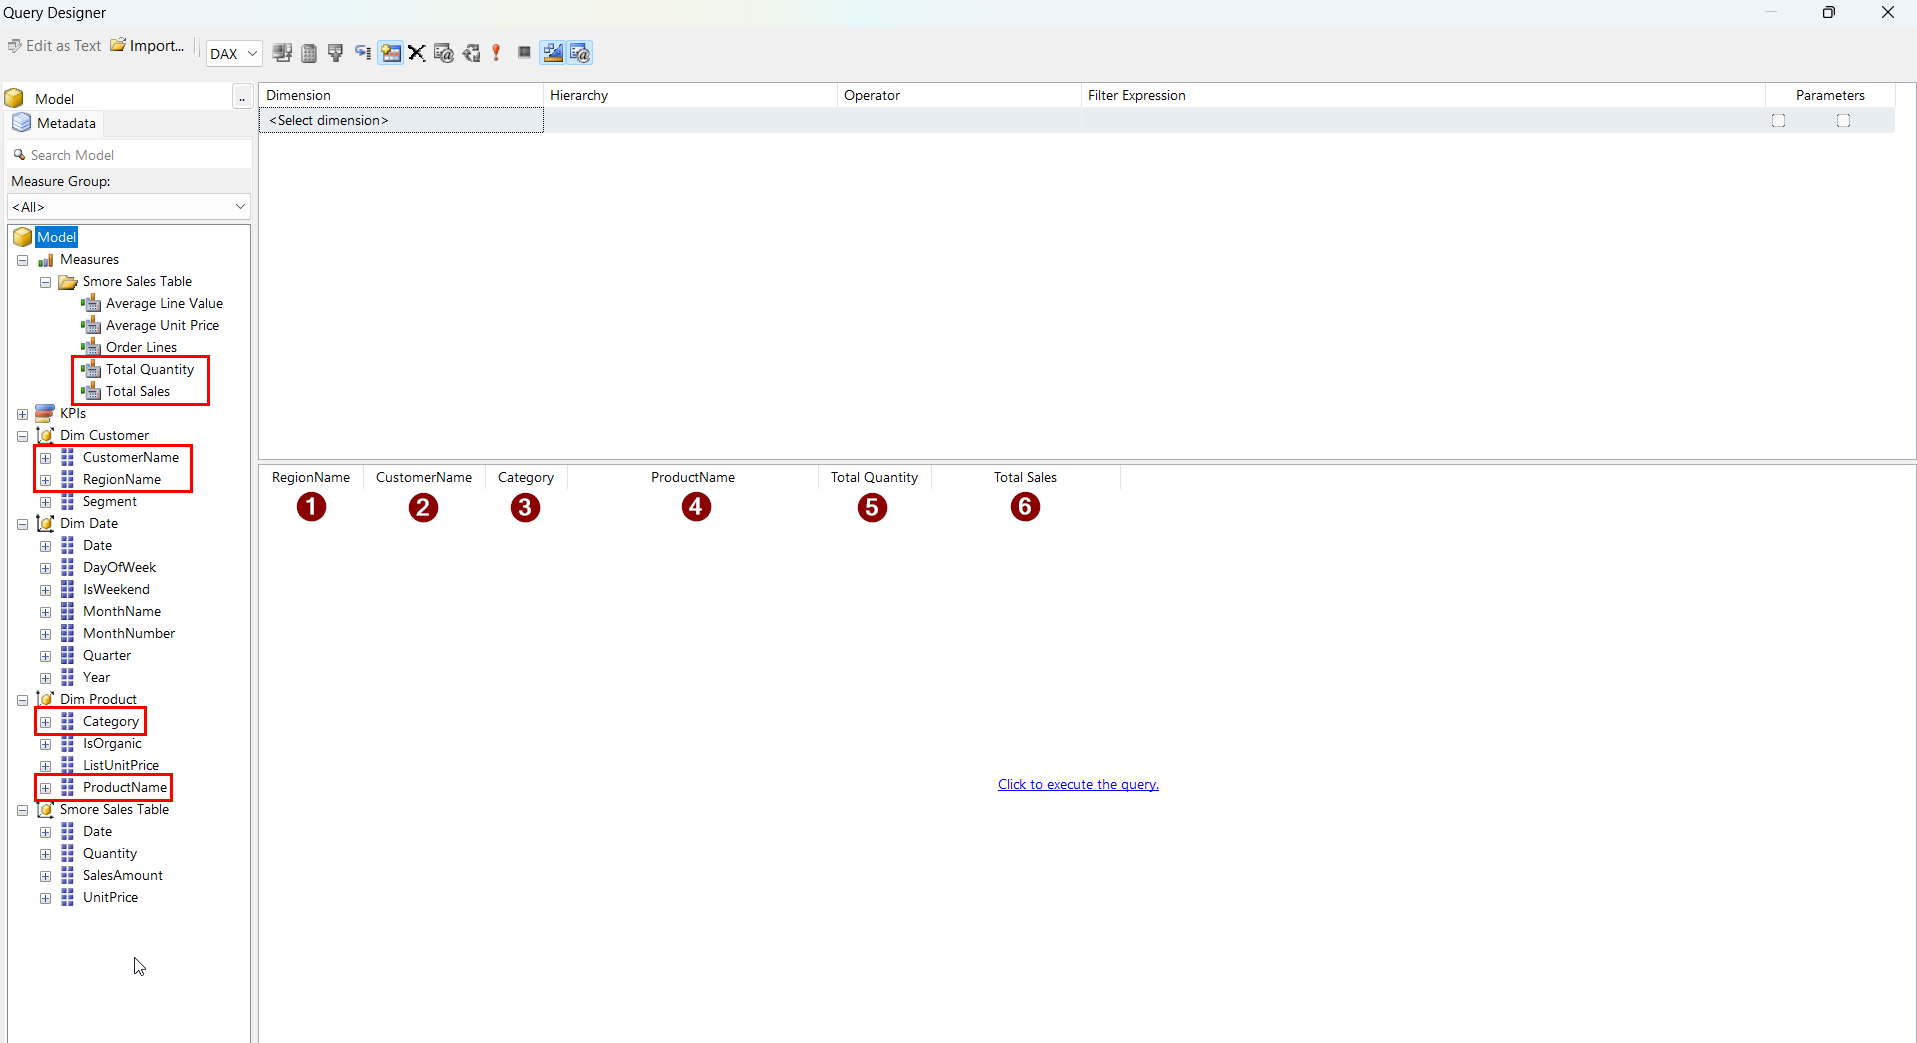
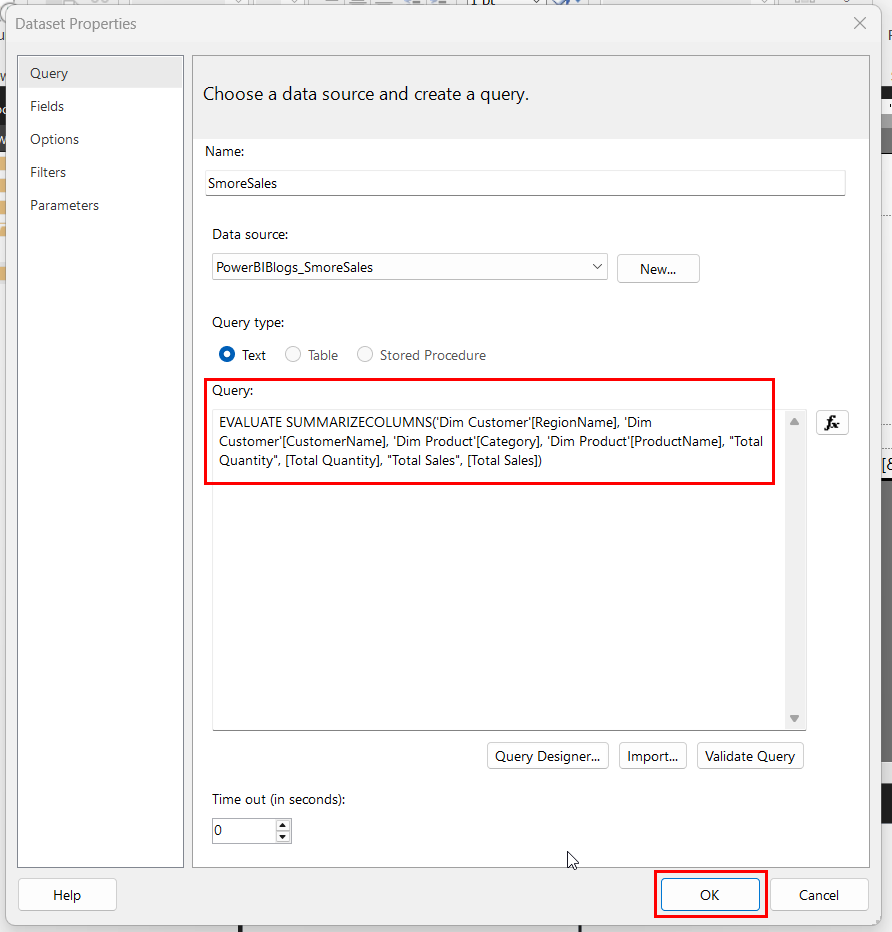
Execute the query, then click OK. You should end up with something close to this:
EVALUATE
SUMMARIZECOLUMNS (
    'Dim Customer'[RegionName],
    'Dim Customer'[CustomerName],
    'Dim Product'[Category],
    'Dim Product'[ProductName],
    "Total Quantity", 'Smore Sales Table'[Total Quantity],
    "Total Sales", 'Smore Sales Table'[Total Sales]
)
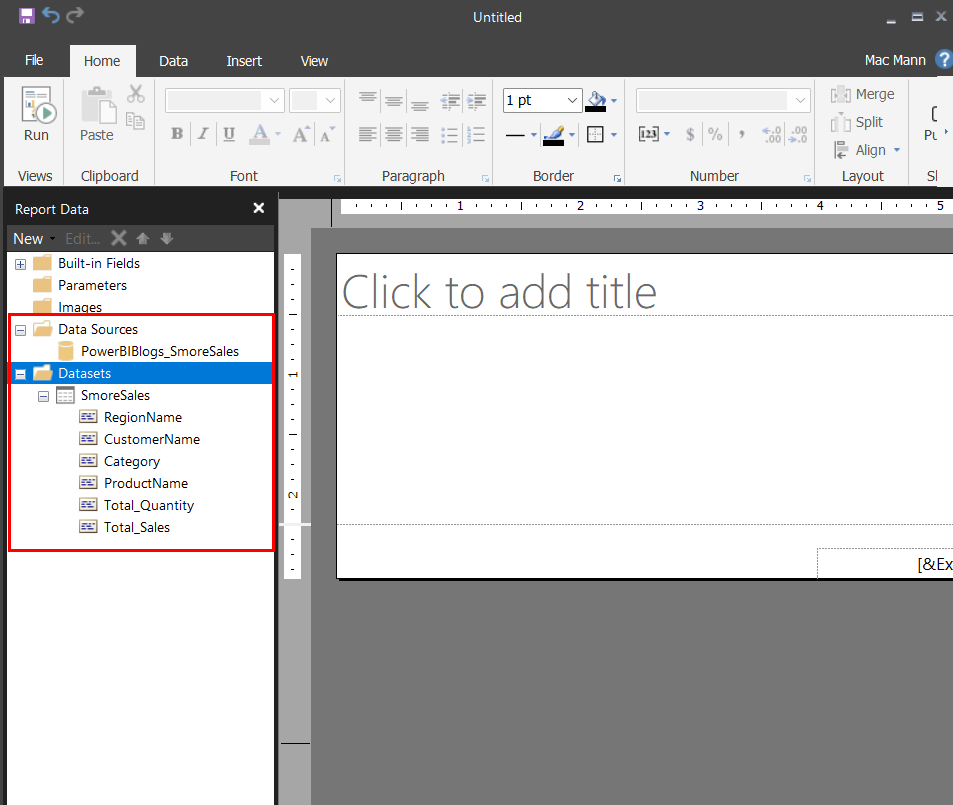
Click OK once more. While you’re in there, note the folder structure: Data Sources and Datasets are separate nodes in the Report Data pane, and a single data source can feed several datasets. That matters when one report needs two differently-shaped result sets from the same model.
Keep the field list short
You are building one wide flat table, and every column you add gets fetched every time the report runs — unless it ran in the last ten minutes, which Part 4 covers. Unlike a traditional Power BI report, there is nothing sitting behind this telling the report what to include.
Take a light hand. You only need the columns that actually have to print.
It’s tempting to pull in a few extra columns in case somebody asks later. Resist it. In an analytical model those columns cost you almost nothing; here they drive up refresh time every time someone runs the report. For the detail behind that, see Microsoft’s data retrieval guidance.
Cutting columns is only half the battle, because rows need trimming too. Cutting columns keeps the customer’s address out of a revenue report. It doesn’t stop the East sales team’s customers from showing up in the Midwest team’s report. That’s next.
DAX or MDX?
Use DAX.
MDX exists for a narrow set of cases: query-level calculated members, or server aggregates in non-detail groups. If you have no idea what those are, you don’t need MDX, and the DAX designer is the one Microsoft points you toward for semantic model connections.
Now lay the table
A dataset on its own displays nothing. It’s a result set sitting in memory waiting to be told where to go.
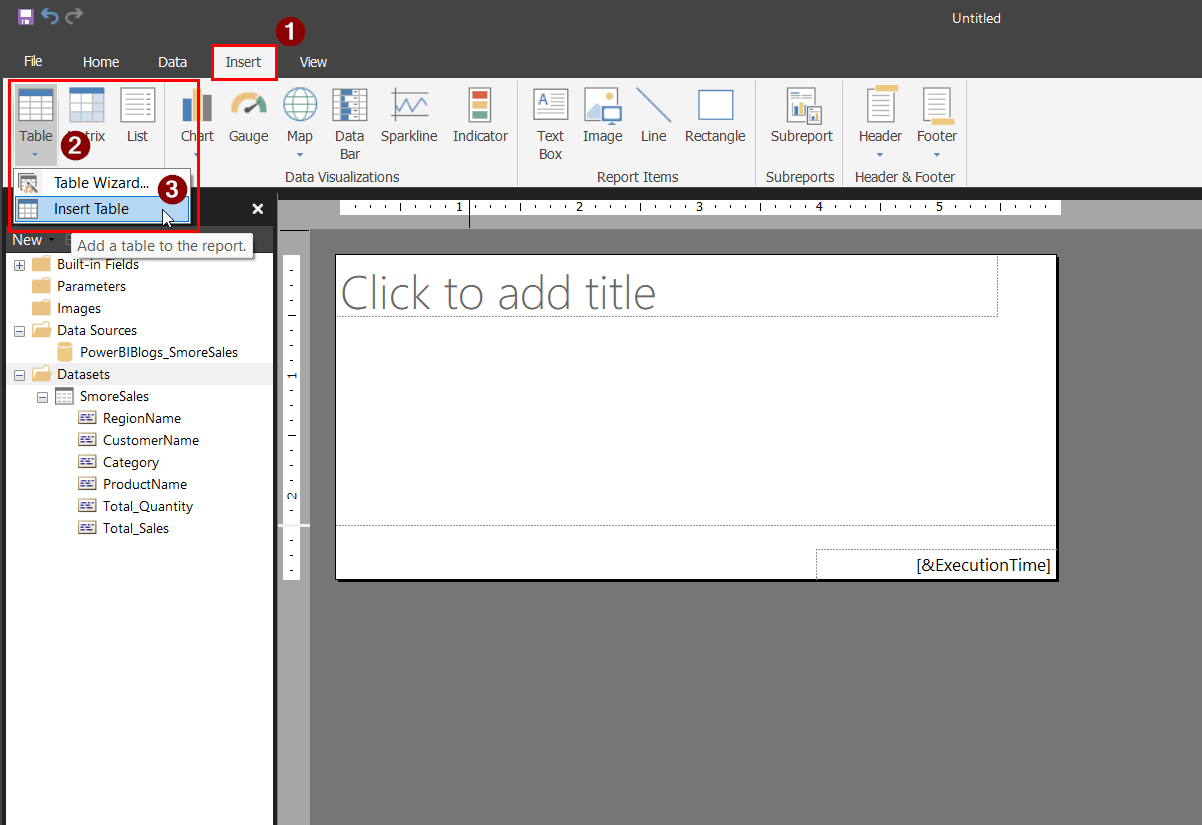
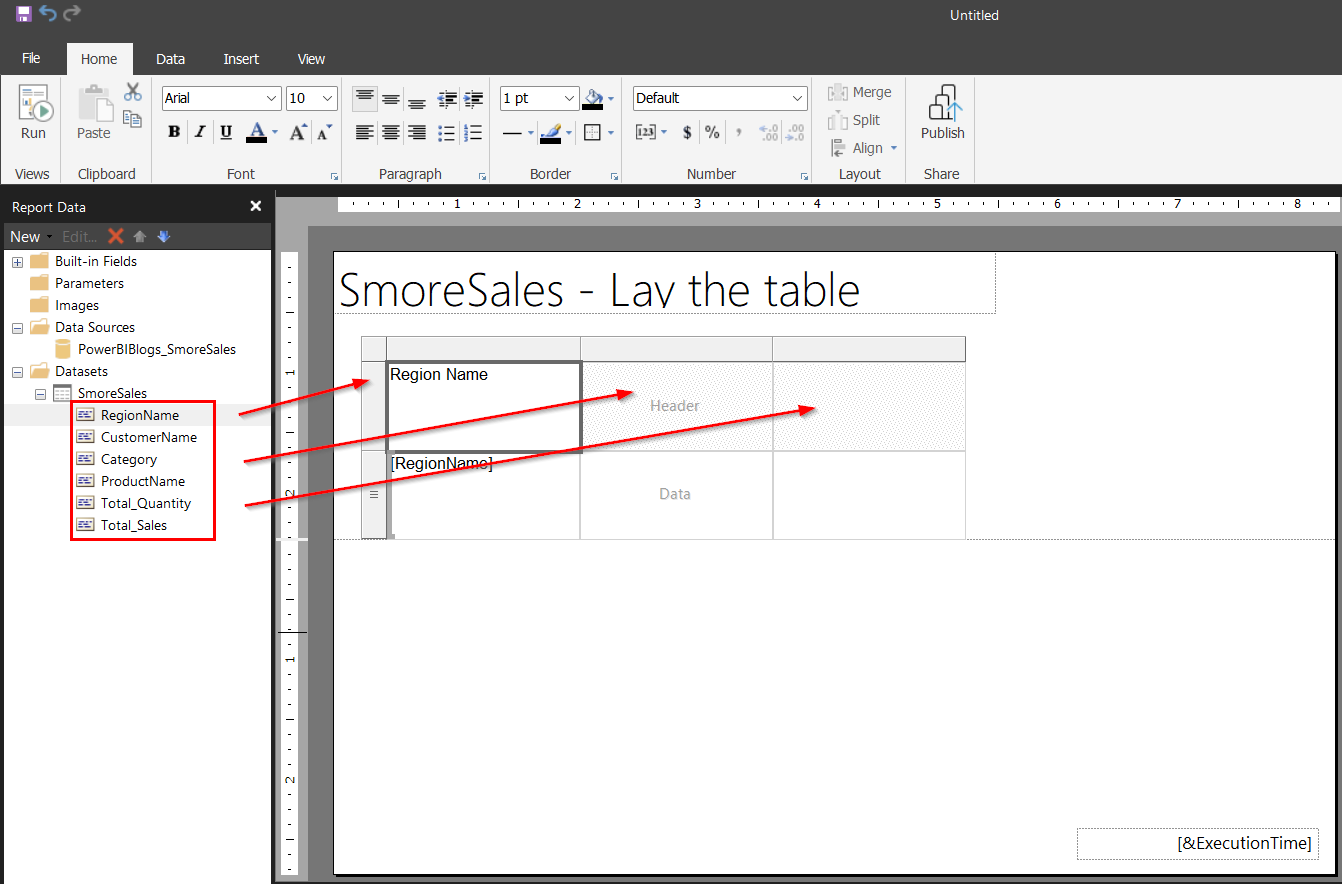
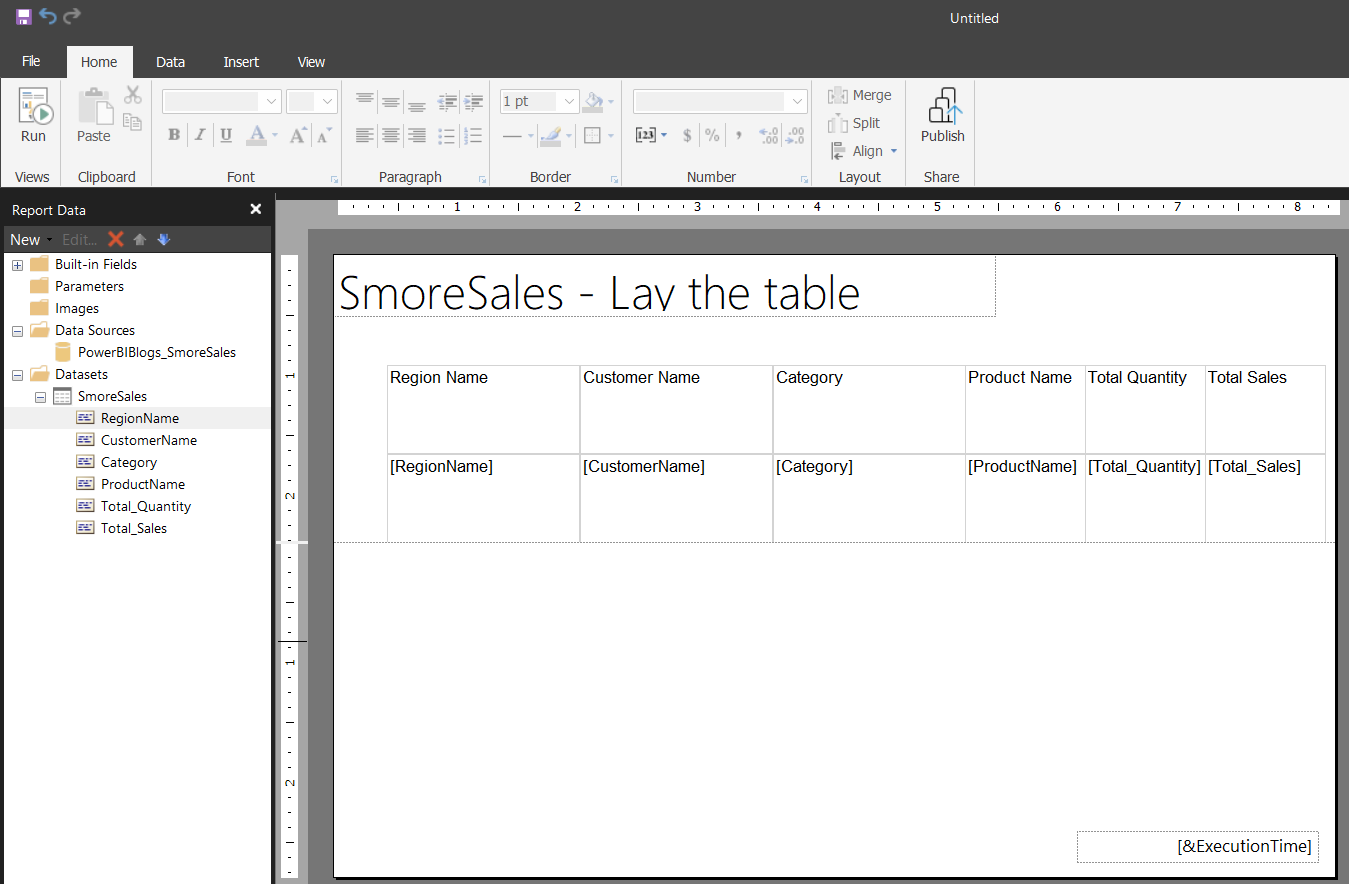
Click Run to preview, and you’ll get this.
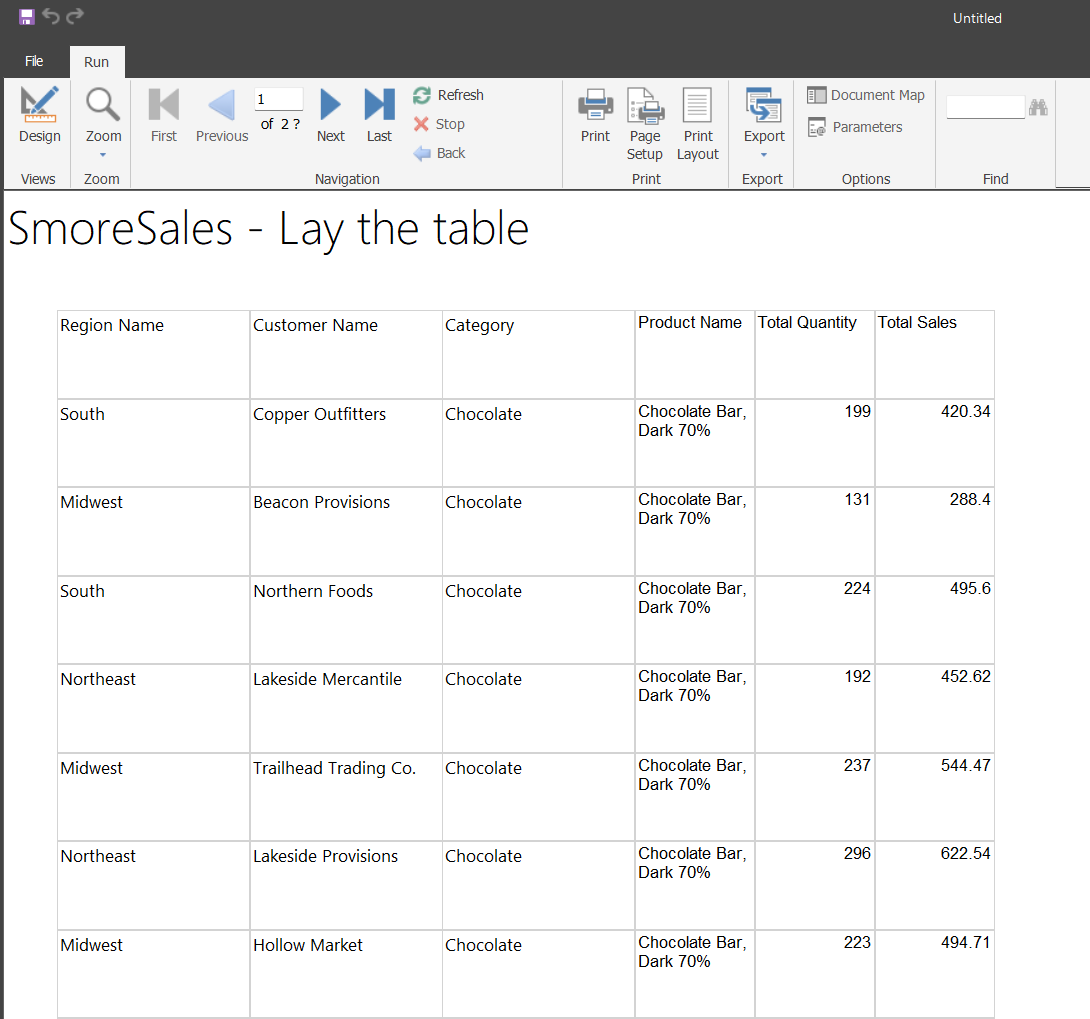
What you’re looking at is a Tablix, Report Builder’s one control for tables, matrices and lists. It will look plain, almost certainly run onto more pages than you want, and the headers won’t repeat yet. All of that is fixed in Part 5.
Your numbers should be right now, though. Check the total against the model before you go any further, because everything from here on assumes the underlying data is correct.
To check, right-click the bottom row, select Insert Row, then Outside Group – Below.
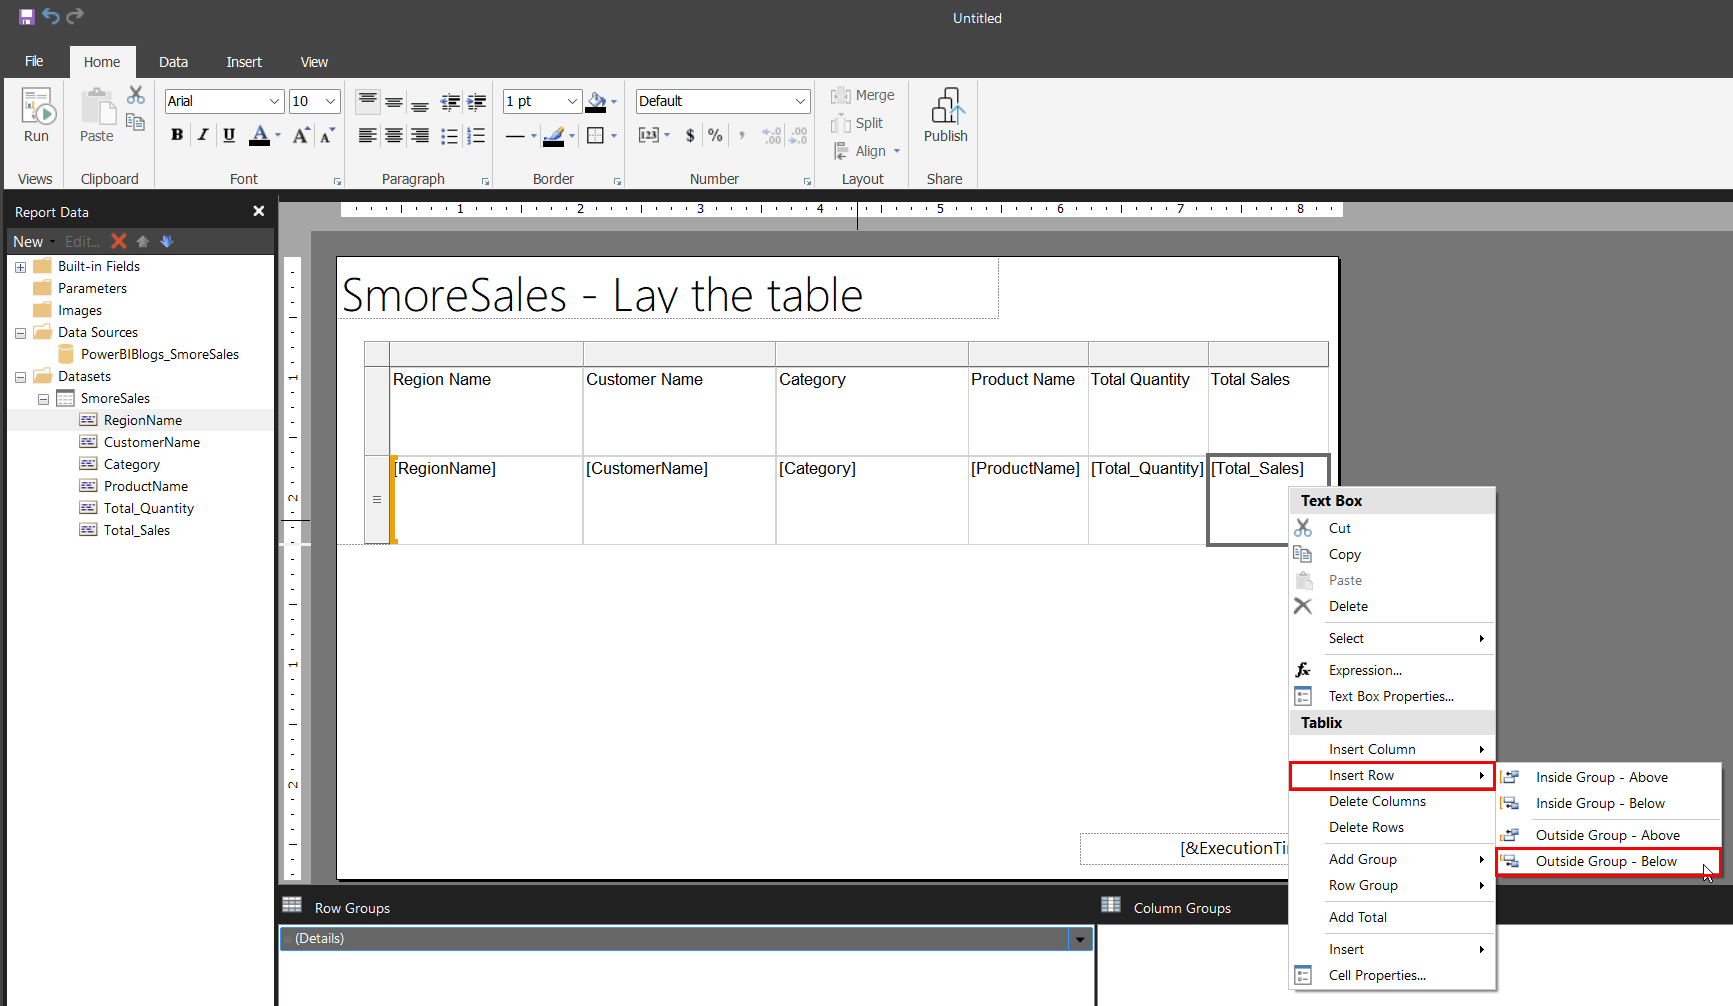
In the rightmost cell, type:
=Sum(Fields!Total_Sales.Value)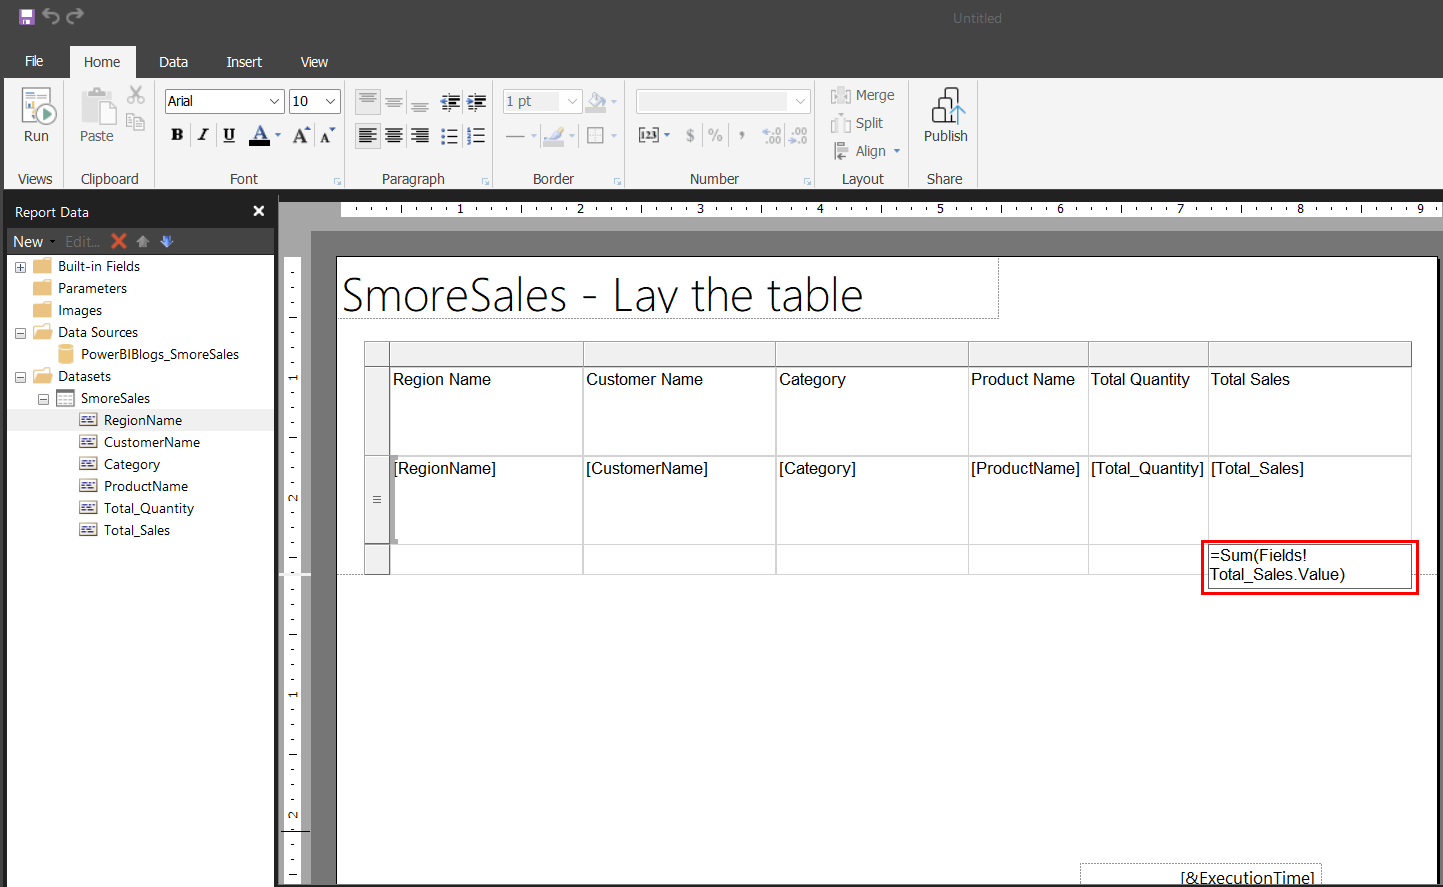
Where this goes next
You have a dataset returning the right numbers and a table displaying them. What you don’t have is any control over how much data comes back, which matters the moment the report is aimed at a real audience rather than a test.
Nobody needs all 12,000 order lines, which this query groups down to 1,920 rows. The Midwest sales team needs the Midwest rows, East needs East, and finance needs last month’s numbers for everyone. Getting the report to return only that — and deciding whether the reader chooses or you choose for them — is the next post.
Next in this series — Part 4 Adding Parameters and Filters to Your Paginated Report