Paginated Reports 101 — Part 4 of 5. This post picks up from Part 3, where we built a dataset returning 1,920 grouped rows. If you want the figures to match, build the model from the sample files and setup guide first.
Where we left off: a dataset returning 1,920 rows, every number correct, and a report nobody would want to receive, because it looks terrible.
In Part 3 we cut columns. Here we cut rows, which is what turns the report into something somebody finds valuable. In a strict sense your report works today, but it’s also dozens of pages long, and that is not what your executives are hoping for.
There’s a catch, and it’s the same kind as last time. Four different things in Report Builder will reduce what your report shows. They have confusingly similar names, two of them are nearly interchangeable, and picking the wrong one trades performance against control. Microsoft keeps a comprehensive reference for the parameter side of this.
Four things, four names, all nearly the same word
| What | Where it lives | What it does |
|---|---|---|
| Query parameter | In the query, before the data leaves the model | Reader picks a value. Only matching rows are returned. |
| Query filter | In the query, before the data leaves the model | You pick the value. Reader can’t change it and never sees it. |
| Dataset filter | In the .rdl, after the data arrives | Discards rows that already crossed the wire. |
| Tablix filter | In the .rdl, after the data arrives | Hides rows from one table while others still see them. |
The top two happen at the query level. The bottom two happen at the report level. That distinction drives everything else in this post.
Where the filtering happens is the whole ballgame
Here is what actually happens when you run your report. It connects to the semantic model, sends a DAX query, waits, receives some or all of the data, then lays that result out on pages.
Filter at the query level and the model never sends the rows to Report Builder at all. Your query asks for the Midwest, and 544 rows come back instead of 1,920. Use this when your readers will never need other subsets — a report built specifically for the Midwest team, for instance.
Filter at the report level and all 1,920 rows travel from the model to Report Builder, sit in memory, and then the report throws most of them away before drawing anything. This is useful when the report genuinely needs to cover everything and someone has to choose what gets presented, when.
Why this matters more than it looks
Both routes reach the same output with dramatically different performance. On a real operational model, where the difference is a few hundred rows against a few hundred thousand, it’s the difference between a report that runs and one that times out or makes your users give up.
So the rule: filter at the query level unless you have a specific reason not to. The easiest way to decide is to answer one question. Will I ever need all the data in the semantic model to build this report? If no, use query filters. If yes, ask again — it’s unlikely that a four-to-eight-column paginated report needs everything in a large model. Microsoft’s performance and scalability considerations go deeper.
A query parameter: the reader chooses
A parameter is a question the report asks before it renders. Which region? Which month? The reader answers, the answer goes into the query, and only the matching rows come back.
The quickest way to make one is to let Report Builder do the wiring.
Right-click your dataset and click Query Designer.
Drag RegionName from Dim Customer into the filter strip at the top, not the center grid. This is the one place in the Query Designer where the drop target isn’t the middle.
Set the operator to Equal and leave the expression blank.
Tick the Parameters checkbox at the end of that row, and execute the query.
Click OK.
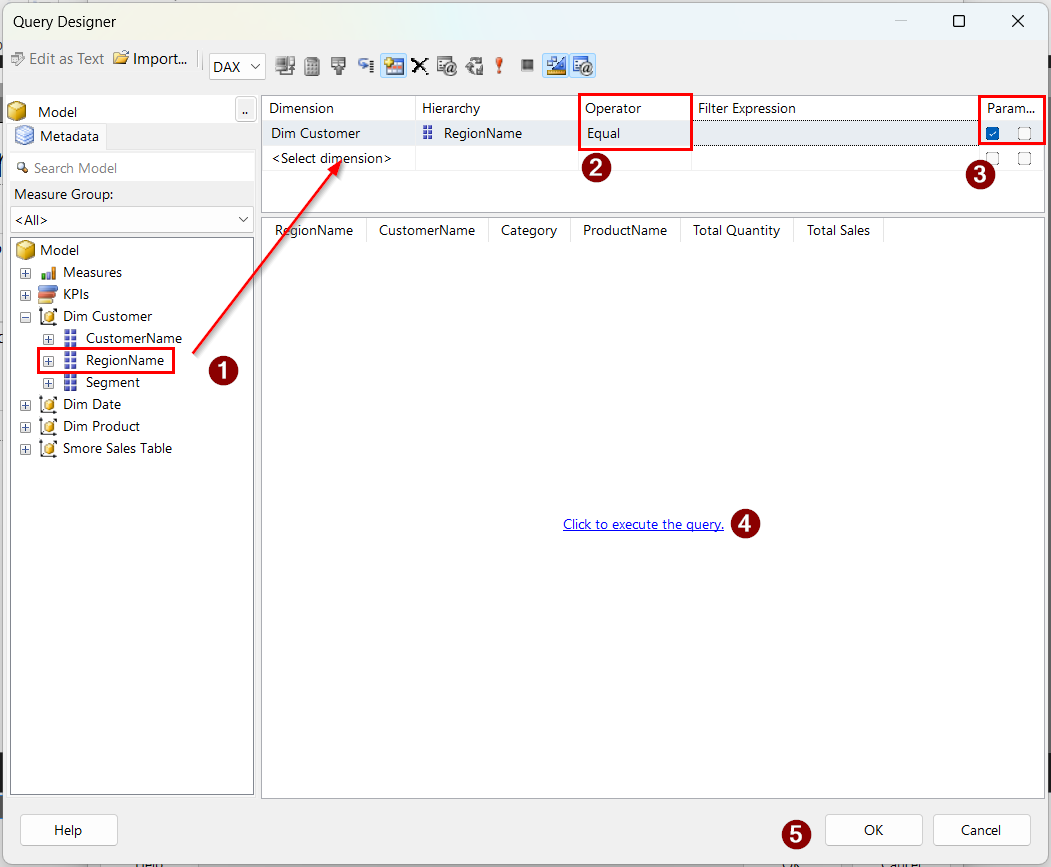
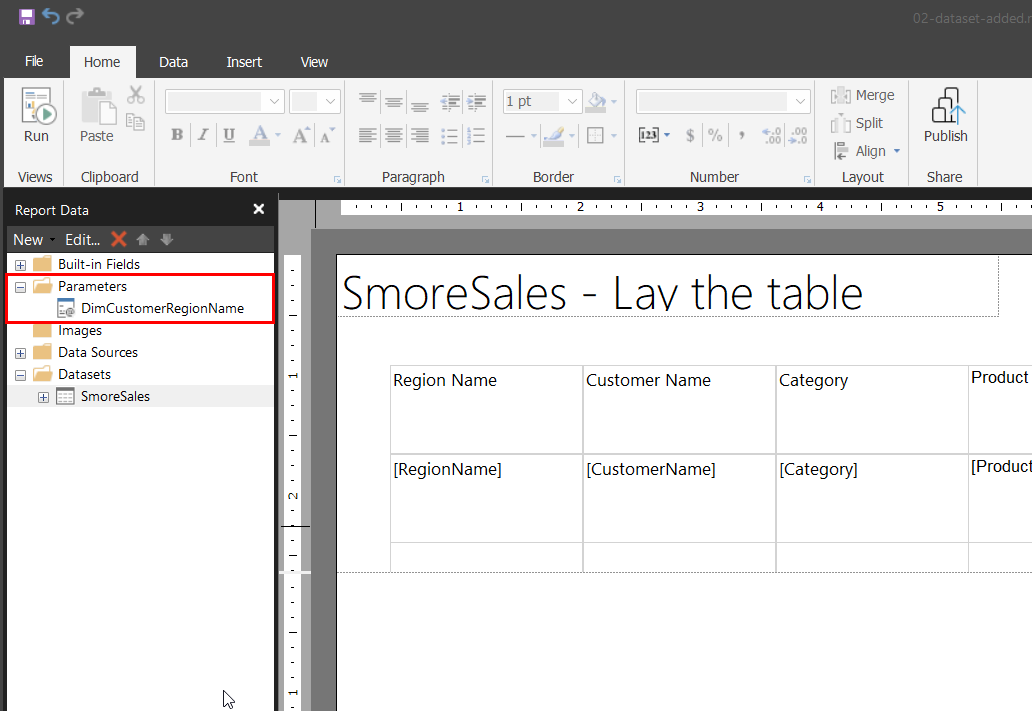
That tick does a lot of work. Report Builder writes the filter into your DAX, creates a matching report parameter, and connects the two. Look in the Report Data pane and there’s now a Parameters folder with DimCustomerRegionName in it.
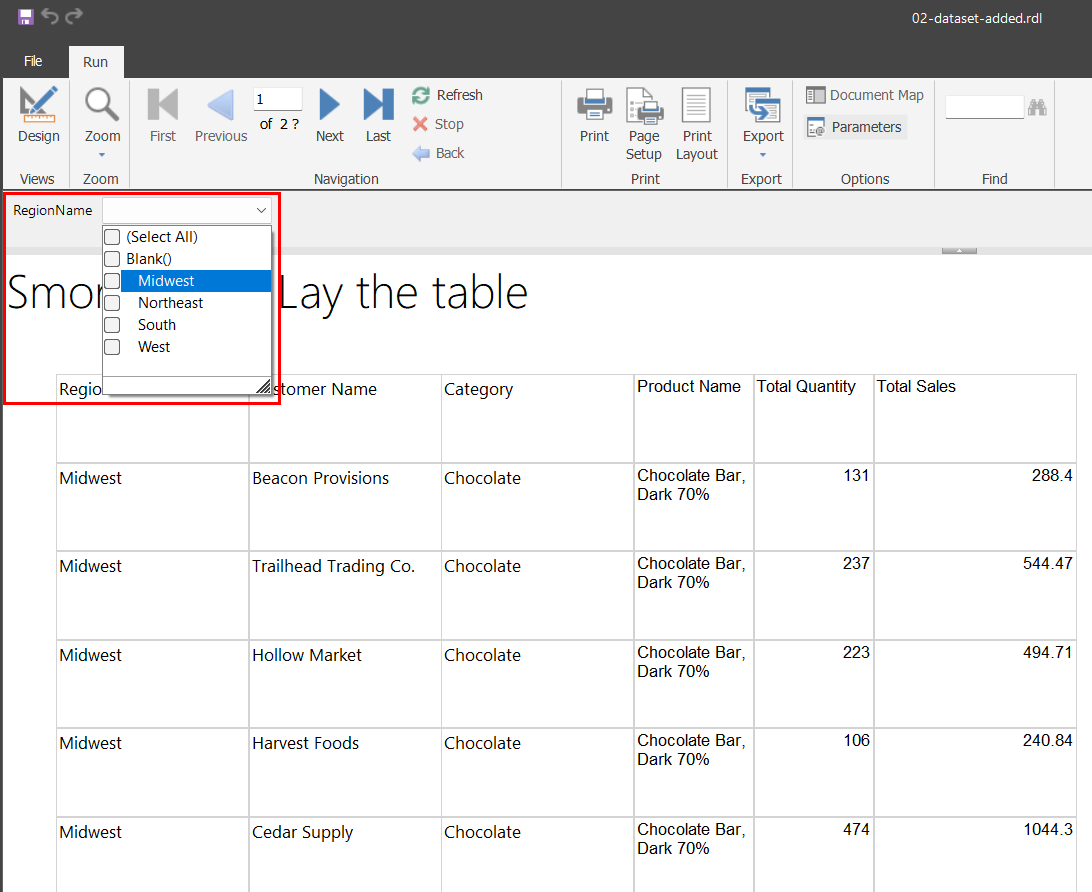
Run the report and you’ll be asked for a region before anything renders. Pick Midwest and you get 544 rows across roughly 19 pages, totaling $822,298.65. Pick a different region and the whole report changes. One .rdl file, four different reports.
Making that parameter usable
What Report Builder generates works, but it can be rough. Ours configured itself to pull from a defined list of available values, which is the expected behavior — ticking the Parameters checkbox creates the report parameter and the hidden logic that supplies valid values.
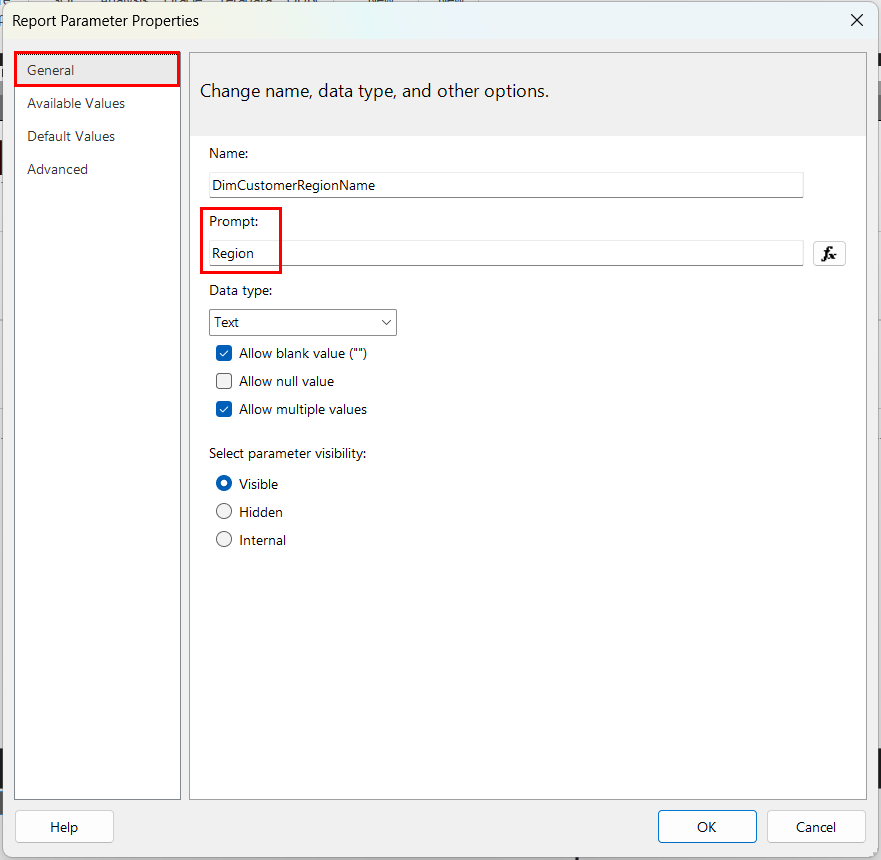
Sometimes it gives you a free-text box instead, which means your reader has to know that “Midwest” is spelled exactly that way and that “midwest” or “Mid-West” returns nothing. If that happens, fix it. Right-click the parameter in the Report Data pane and choose Parameter Properties. Three things are worth setting.
1. The prompt. On the General tab, change the prompt text to something a human wrote. “Region” beats “RegionName”, and this is the label your reader actually sees.
2. Available values. This turns a text box into a dropdown, and it’s the single biggest usability win here. You can type the four regions in by hand, but point it at a query instead so the list maintains itself when a fifth region appears. Add a second dataset returning the distinct region list, then on the Available Values tab choose Get values from a query. If you followed the steps above, your parameter is already pointing at one.
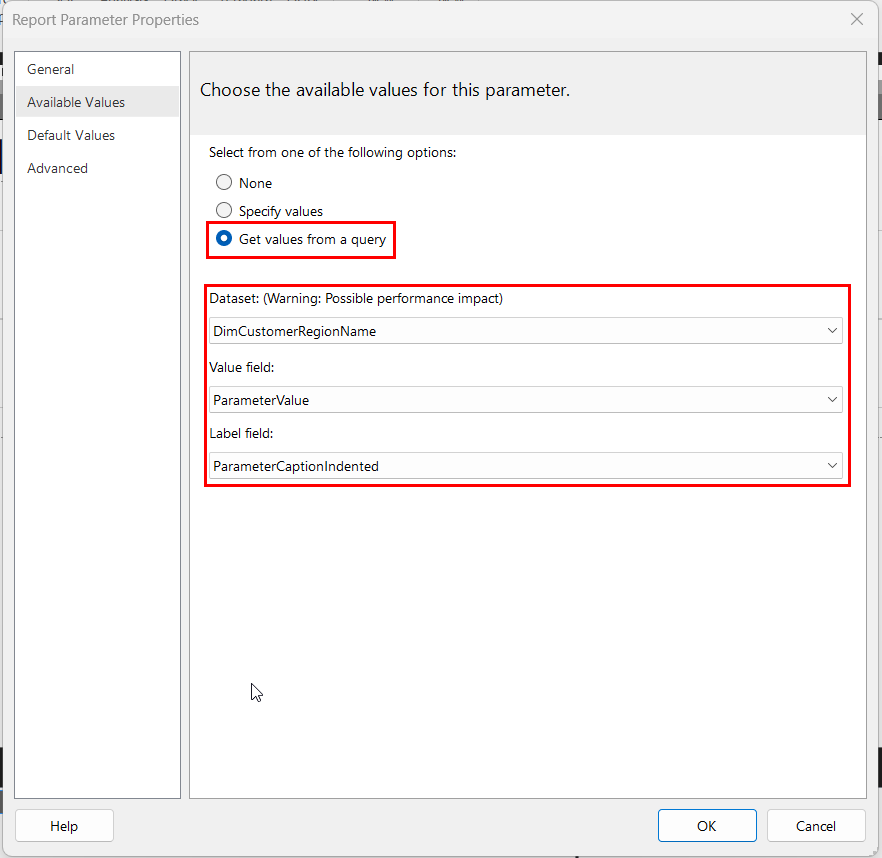
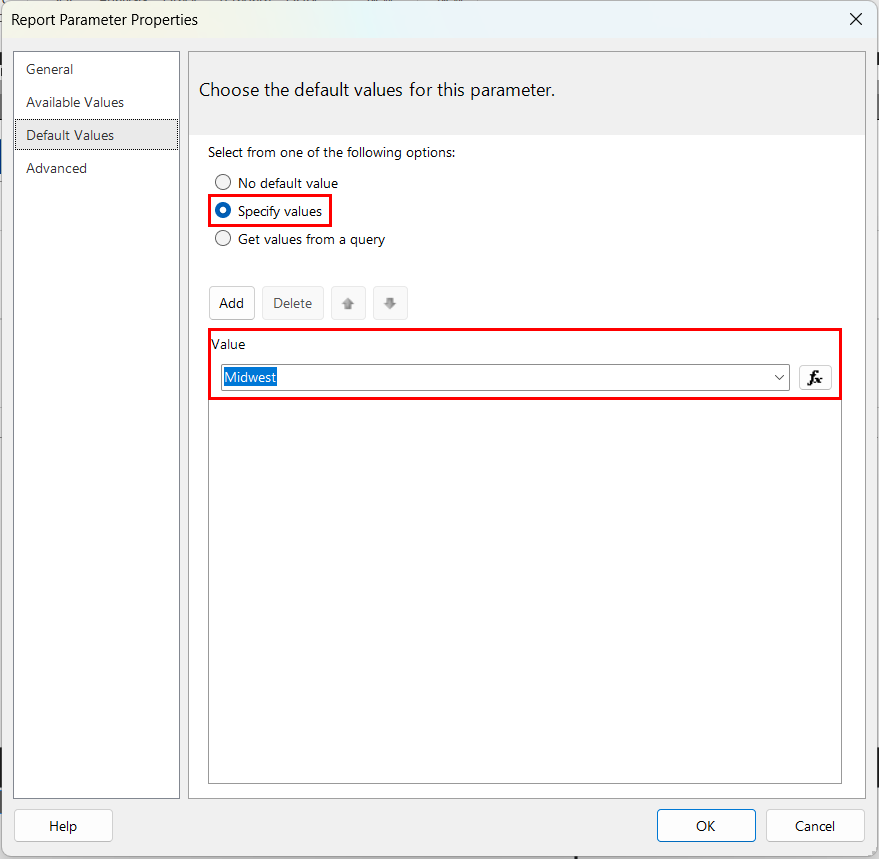
3. Default values. Set one. Without a default, your reader opens the report and stares at an empty prompt with nothing rendered, which reads as broken even though it isn’t. With a default, the report opens showing something and they can change it.
If you want the reader to pick more than one region at once, tick Allow multiple values on the General tab. That changes how the parameter behaves in your query, so test it rather than assuming.
Cascading parameters are worth knowing about too — choosing a region narrows the customer list to only that region’s customers. That gets genuinely useful once your dimensions grow, and Microsoft has both a walkthrough and a design guide rather than something we’d compress into a paragraph.
A query filter: you choose, and the reader can’t
Now the other one. Same place in the Query Designer, one difference: leave the Parameters box unticked, and select “Midwest” in the Filter Expression. Run the query again.
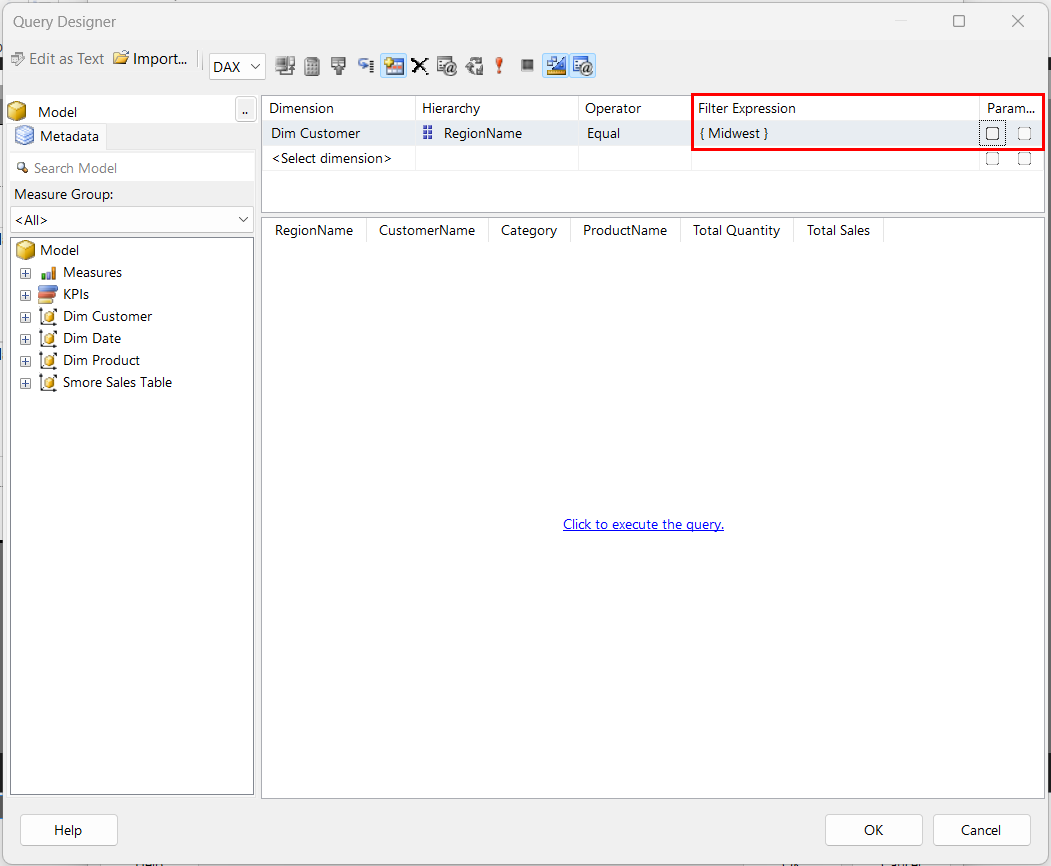
That’s the whole distinction. Unticked, the filter is baked into the query. It runs every time, the reader is never asked, and there’s nothing in the interface to suggest a choice was ever available. The report simply is a Midwest report.
This is the right answer more often than people expect. If you’re building a report for the Midwest sales team, they don’t need a region picker. Giving them one adds a click, invites mistakes, and creates a support conversation the first time somebody picks Northeast and wonders why the numbers look wrong.
It’s also not security. A baked-in filter shapes the report; it doesn’t stop a determined person from getting the underlying data another way. If Midwest managers must not see Northeast figures, that’s row-level security on the semantic model, which your paginated report inherits automatically. Filters are about relevance. RLS is about permission. Don’t ask one to do the other’s job.
One thing that surprises people: a query filter here produces the same result as putting the same filter on a table visual in Power BI Desktop. Same model, same filter, same numbers. If you’ve validated the figure on screen, the printed version agrees — which is the whole point of connecting to a shared semantic model.
Can I have a dropdown without a parameter?
You can rig one. Think twice before you do.
It’s possible to leave the filter unparameterized in the query and let the reader choose using a report-level filter instead. The dropdown appears, the report responds, everything looks fine. But the query still fetched every row before the filter did anything, so you paid the full data cost for a subset view.
On 1,920 rows nobody notices. On a real fact table it’s the difference between four seconds and four minutes. If the reader gets to choose, put the choice in the query.
What dataset and Tablix filters are actually for
Which brings us to the two we’ve been dismissing. They have jobs. They’re just not this one.
- A dataset filter is useful when you can’t change the query — a shared stored procedure, or an inherited .rdl nobody wants to touch. It’s a workaround, and a legitimate one.
- A Tablix filter is useful when one table on the page needs to show something different from another: a summary showing all regions at the top, a detail table showing only the reader’s region below, both from one dataset. You can’t do that in the query, because the query feeds both.
Neither is about performance. Both operate on data that has already arrived. Reach for them when you need presentation logic, not a smaller report. If you find yourself using a dataset filter to reduce data volume, go and look at why the query can’t be changed instead.
Which one should you use?
Two questions get you there almost every time.
- Does the reader ever need to choose? Yes means a query parameter. No means a query filter.
- Am I filtering to reduce data, or to present it differently? Reduce means query level. Present differently means dataset or Tablix.
Almost every paginated report we build ends up with a couple of baked-in query filters that define what the report is, plus one or two parameters for the choices that genuinely vary. Getting that split right at the start saves rebuilding it later, and it is much easier to add a parameter than to unpick one.
Where this goes next
It’s still pages of unformatted table, with headers that don’t repeat and a page count you can’t see. Which is fine, because that’s what the last post in this series is about: making the thing actually printable.
Next in this series — Part 5 Getting Your Paginated Report Print and View ReadyRelated: How to Fix Date Pickers in Paginated Reports picks up where this post leaves off, on the one parameter type that causes more trouble than all the others put together.