the caf2code press
Paginated Reports 101 – Building your first Paginated Report off of a Power BI dataset
Paginated Reports 101 Part 4: Adding Parameters and Filters to your Paginated Report

Multiple components in the Power BI ecosystem are referred to as parameters and filters. For this reason, I’m going to be heavily qualifying and color-coding throughout this blog post to make it a little easier for you to follow.
Understanding parameters, filters, and slicers in the Power BI ecosystem:
The parameters and filters you’ll build in Power BI Report Builder serve a similar purpose to slicers and filters used in Power BI Desktop.
In Power BI Desktop, both slicers and filters can empower the end-user of a Power BI report to select the section of the data that interests them. Conversely, if the report writer wants to apply a hidden filter to a visual, page, or report that a report user cannot change, she can do so by making that filter invisible. Parameters in paginated reports work somewhat like filters and slicers in Power BI reports; depending on how you set them up, they can both function as a static filter that the report user never sees or as a dynamic filter that allows the end-user to choose the data of interest to him.
As I mentioned before, this gets very confusing very quickly—so let’s go through each component individually.
Parameters and filters that are applied at the Query Level:
Query-level parameters are passed back to the data source (your Power BI Dataset) at the time that a report user plugs in their selections, resulting in just the subset of data they are interested in carrying into the report. You can define these in the query designer in the red box below. Checking the first parameter box tells the Power BI Report Builder that you’re setting up a parameter rather than a filter. Checking both parameter boxes is an option that will only show up when you’ve selected a range, which you’ll often want for dates. If you click one box rather than both, the box you don’t check will behave as a filter. You might choose to check just the second parameter box if you want the report data to be filtered to only include data on or after a specific date, but you still want to give report users full flexibility to define the end date at report time.

Assuming the “Enable Multi Value Parameters” button is turned on (see image below) the query designer will employ the RSCustomDaxFilter formula to pass either single or multiple value parameter selections from the report back to your Power BI dataset using DAX. The formula output will look something like: “RSCustomDaxFilter(@StateRegionsRegion,EqualToCondition,[State Regions].[Region],String)”.

What happens when you add a query-level parameter? A surprising amount, actually!
When you add a query-level parameter (like the ones in the above image), Power BI Report Builder does the following things automatically:
- The parameter is translated into the DAX query so it can act as a filter based on the user’s selection(s)

2…Then the parameter is added to the parameters list under Dataset Properties

- A hidden dataset is generated to support the drop-down list that will populate in the report’s parameters pane, and
- A corresponding report parameter will populate under the Parameters folder in the Report Data pane, and
- A drop-down list for that parameter populates on the report’s parameters pane.

Together, these five components create a kind of parameter relay race, first defining what the report writer can choose, then carrying the report user’s selections back to the query, and ultimately generating the report’s desired result.
While the default output for the parameters you set up in the query designer will generally work fine as a starting point, you can often improve the report by updating these steps. A good example is updating dates to use date pickers rather than a drop-down list—something that’s covered beautifully in the following blog: Using Date Pickers in Power BI Report Builder (coeo.com)
Knowing what is happening at each stage of the query-level parameter is the first step toward being able to customize them to meet your specifications.
Query-level filters are also passed back to the data source (your Power BI dataset) when a report is run. Unlike query-level parameters, which give report writers the flexibility to define what data the report’s query retrieves at query time, query-level filters are “baked in” to the paginated report.
Use case: You might want to use a query-level filter in situations where the nature of the report only requires a subset of information from a table regardless of an end-user’s role. For example, if we were building a report for just the Midwest sales team, we could apply a filter like the one below, intentionally leaving the parameter box unchecked. Use query-level filters instead of query-level parameters when you need to constrain the report data without giving the report user the option to change how that data is constrained.

Using a Query-level filter in Power BI Report Builder’s Query Designer will generate the same output as a corresponding table visual with the same filter applied in Power BI Desktop. While the underlying query that the Power BI Report Builder and Power BI Desktop automatically generate to get the table output will be somewhat different, the resulting table will be the same (all else being equal). To see the underlying DAX query for a table in Power BI desktop, you can use the Performance Analyzer to copy the query that supports the visual display.

If you compare the output from each, you can see that both are filtering the data; they’re just using different DAX expressions to get the same result.

Dataset-level filters perform a different task from filters at the query level. Any filters you add under Dataset Properties are applied after the query is run, using input from the report user. You can set up this kind of filter to function like a parameter in the report, where an end user can select from a dropdown list to define the output. The key difference will be that the query will pull more rows than needed to generate the report that you have in mind.
Why might you want to have a query pull in all rows, and then filter it down after the fact? When the query pulls in data, the results of the query are cached for a short period (about 10 minutes) to limit the need to re-query the dataset. In some situations, you may want to take advantage of this caching by having all rows pulled in at once, then filtered down when users select from the drop-down list. Because the data is already cached, a user switching from one filtered selection to another will get the output more quickly because a new query doesn’t need to be run to repopulate the report. If you anticipate users will generally interact with a paginated report in this fashion (by toggling between multiple selections to review or download data), setting up filters may be the right option for your situation.
Most of the time, however, you are better off using query-level parameters rather than dataset-level filters. Because query-level parameters are pushed back to the dataset and retrieve only a subset of the data, the time necessary to retrieve query data will be faster than pulling in all possible rows for that query and then filtering it after the fact.
The Parameters Pane and Parameter Properties

The Parameters Pane defines what a report user can select to get their desired report output. For simplicity, let’s refer to the objects you select in the Parameter pane as report-level parameters. Report-level parameters enable report users to choose from a drop-down list or a date-picker to define the subset of data they would like to see for a report. These selections can be passed back to either query-level parameters or the filters that you define under dataset properties.
While a drop-down list for each parameter will automatically populate in the report parameters pane after you create a parameter in the query designer, you can still update the properties for that auto-generated parameter or create additional report parameters manually to meet your needs. Just keep in mind that the same “data relay race” needs to be established from the report parameter back to the query for any parameter to function as intended in your report.

Parameter Properties
You’ll notice that a matching parameter will be listed for each report parameter in the “Parameters” folder under report data. These define each parameter with properties like data type, the list of available values, and the default values, if any. These representations of the report parameters are two halves of the same whole; deleting one will automatically result in deleting the other.
Any query parameter that you’ve set up using the query designer will already have important properties filled out for you; these facilitate the connections between the report parameter selections and the paginated report datasets. Some of these just impact the presentation of the report parameters, while others are make-or-break for the relationship between the report parameters and the query parameters or dataset-level filters. I’m going to go through the main fields below but will cover the remainder in more depth in a future blog post.
Report Parameter Properties: General
Prompt (under Name) determines how the report parameter is presented to the report end user; changing the prompt will not impact the report’s functionality. Using a prompt like “Select Region” rather than simply “Region”, for example, may improve the user experience and would not change how the parameter is passed back to the query.
 Be careful with the following two selections, which will change how a parameter is passed back to the query:
- Name: The Report Parameter’s Name is used to associate the Dataset Parameter with the Report parameter. If you change a parameter’s name, that name will need to be updated for both the Report Parameter Properties and the Dataset Properties for Parameter Value. If you update it in one place but not the other, you’ll get an error message at report run time.
- Data Type: If the report parameter and query parameter don’t have matching data types, you will get an error. Be sure to compare the data type listed in the parameter properties against what the query parameter expects to pass back to the query.By default, the main dataset where you created your parameters will pass the report parameter back to the query using RSCustomDaxFilter (again, assuming you’ve turned on that Enable Multi Value Parameters option I’ve pasted again below).
 In the region parameter example used throughout these screenshots, the full DAX for this parameter is RSCustomDaxFilter(@StateRegionsRegion,EqualToCondition,[State Regions].[Region],String). Because the data type String is synonymous with text, our parameter data types are in alignment (meaning no errors at report run time!)
Report Parameter Properties: Available Values
Remember how Power BI Report Builder will automatically generate a hidden parameter dataset when you use Query Designer to add a parameter? This is where they come in; the hidden dataset feeds into the Available Values for that parameter as designated under Available Values -> Dataset. In the example below, you can see that the @Region parameter’s values are populated from the StateRegionsRegion Dataset using the Parameter Value Field. The Label Field comes from “ParameterCaptionIndented”, which is not coming from the query itself, but rather an expression that adds spaces to the Parameter Caption Value based on its parameter level. While the hidden dataset will work as-is, you can always update the dataset to meet your needs provided you update the Value Field and Label field accordingly. For example, I could update the “StateRegionsRegion” dataset to just include a single field named “Region” with the four region values and use that field for both the Value and Label fields for the Region parameter’s Available Values.

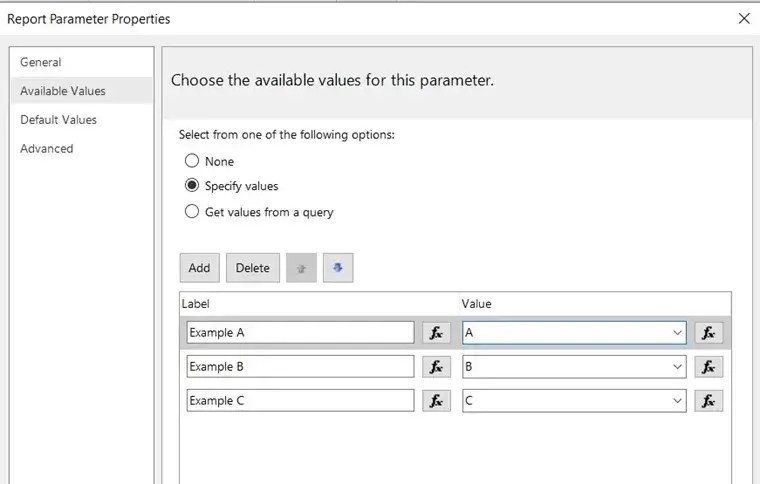
There are two other options on the Available Values list:
- The “None” option will produce a blank box that a report user will fill in rather than a drop-down list. This can make sense when a report user will only be interested in a single value and can be trusted to plug it in precisely.
- The “Specify Values” option will create a drop-down list based on hard-coded values that you define. You’ll see the Available Values window update to a view like the one below where you can specify the label and value for each parameter option. This is a workable alternative to getting the report’s parameter values from a query if you only want to list a few options that will rarely change—but in most cases, I prefer getting values from a query to limit the amount of future manual maintenance.
Report Parameters: Default Values
Including a default value for every parameter will allow a “default” version of your report to populate before your report writer makes any selection. If you specified a single value for your parameter when you set it up in the Query Designer, it will automatically populate here as your report’s default value.

Understanding how each component of parameters and filters works within Power BI Report Builder can make all the difference when updating or troubleshooting a report. I hope this blog post empowers you to tackle your next paginated report parameter issue with confidence.